Doge Pepe
 Crawlerpad
 Quant
Quant Pearl
Pearl Starknet
 Optimism
 Zylo Ecosystem

Ethereum price pressed against a long-running technical barrier after recovering from its June lows.
ETH moved from about $1,796 to a recent high near $1,955. It later closed near $1,878 on July 23 after sellers rejected the recovery.
Spot charts showed an early trendline break. However, the weekly and Chicago Mercantile Exchange structures still required stronger confirmation above resistance.
Onchain data also placed heavy supply between $1,980 and $2,080. Clearing that region could expose the CME gap and the larger $2,773 target.
Another rejection would leave lower Ethereum price support levels vulnerable.
Ethereum Price Faces $1,980–$2,080 Supply
Ethereum price trades near $1,880 after struggling to hold above the $1,978 resistance level. Ali Charts identified the wider $1,980–$2,080 region as Ethereum’s strongest nearby on-chain resistance zone.
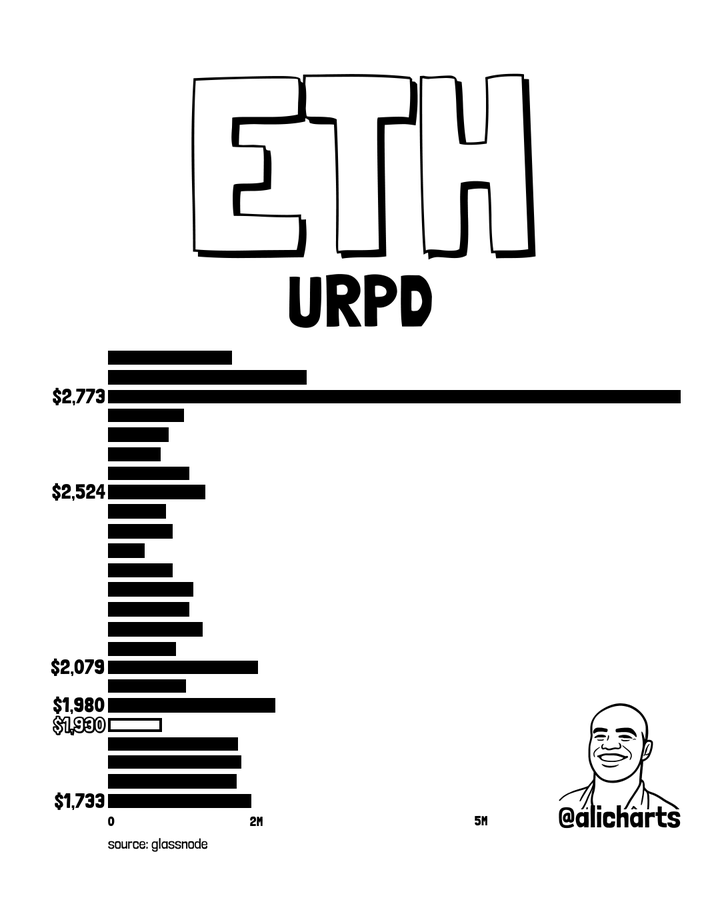
The URPD chart showed a concentrated amount of previously acquired ETH within that price range. Holders who bought there may sell near breakeven, creating additional pressure during another recovery attempt.
Above that zone, the distribution profile shows another notable supply cluster around $2,524. However, the largest visible concentration sits near $2,773, making it the next major target after a confirmed breakout.
Ethereum’s recent on-chain golden cross supports the broader recovery case, but price confirmation remains essential. Buyers need a decisive daily close above $2,080 before the bullish signal can translate into stronger market structure.
ETH Crypto Tests Long-Term Downtrend
Meanwhile, MikybullCrypto’s weekly chart showed Ethereum price challenging a descending trendline drawn from its 2025 peak. Price is also holding above a rising support area that has developed since the 2022 market low.
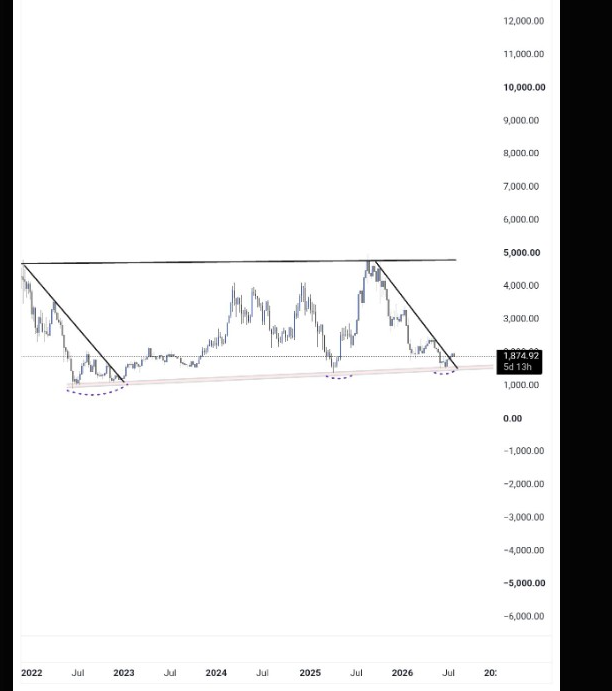
The chart presents a broad multi-year base, with ETH repeatedly finding buyers around the lower structural boundary. Its latest recovery has brought price back toward the point where descending resistance and rising support converge.
Spot price has already moved through the shorter multi-month trendline on some charts. Even so, the weekly candle must hold above that barrier to reduce the risk of another failed breakout.
MikybullCrypto expects a possible 5x move from current levels over the longer term. Such an advance would require ETH to reclaim several barriers, including $2,080 and the historical resistance near $4,700–$4,800.
ETH CME Gap Opens Above Breakout
Additionally, the Ether futures chart showed price testing another descending trendline extending from the October 2025 high. Ethereum currently trades directly beneath this line after recovering from the June decline.
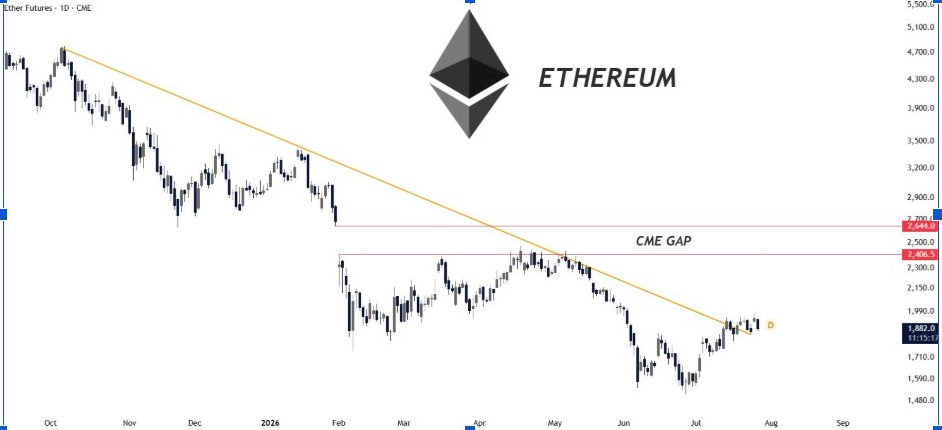
An unfilled CME gap sits between approximately $2,406 and $2,644. Gerla noted that a confirmed trendline breakout could allow ETH crypto to move quickly toward that area as the market searches for liquidity.
The lower gap boundary also sits close to the broader on-chain supply zone around $2,524. This overlap gives the region added technical significance and could attract profit-taking during an extended recovery.
Before reaching the gap, ETH price must first clear $1,980 and establish support above $2,080. Continued rejection below those levels would keep the futures gap out of reach and preserve the wider bearish structure.
Ethereum Price Requires Breakout Confirmation
Ethereum price showed early recovery signals after rebounding from its June lows. The immediate test remained the dense supply zone between $1,980 and $2,080.
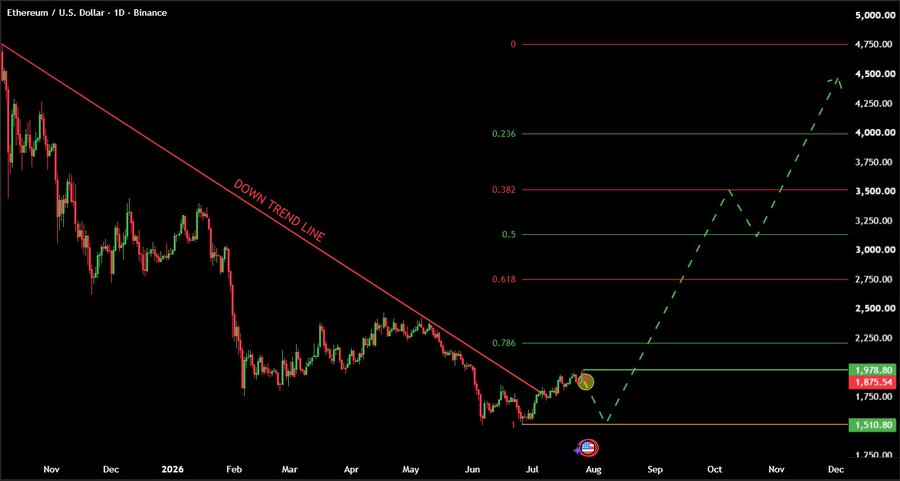
A decisive close above that region could expose $2,406–$2,644. The wider target near $2,773 would then gain relevance.
However, another rejection could return ETH toward $1,733. Continued selling would expose the deeper $1,510–$1,600 support area.
The CME gap, fivefold projection and $2,773 target remain technical scenarios. None guarantees Ethereum price will reach those levels.
The short-term direction depends on whether buyers convert $1,980–$2,080 from resistance into support.