Wisp
Wisp Doge Pepe
 Crawlerpad
 Zylo Ecosystem
 Pearl
Pearl Basic Attention
 Quantus

XLM price is trading near a critical support area after weeks of gradual selling pressure. Buyers have defended the $0.17 region, creating a possible double-bottom structure on the daily chart.
Several analysts now see the current range as another accumulation phase. However, XLM crypto must reclaim $0.21–$0.22 before the technical setup supports a larger recovery toward $0.28.
XLM Price Forms Daily Double Bottom
XLM price trades near $0.171 after testing the $0.17 support zone for a second time. Crypto With Gopal identified the structure as a potential double bottom on the daily chart.
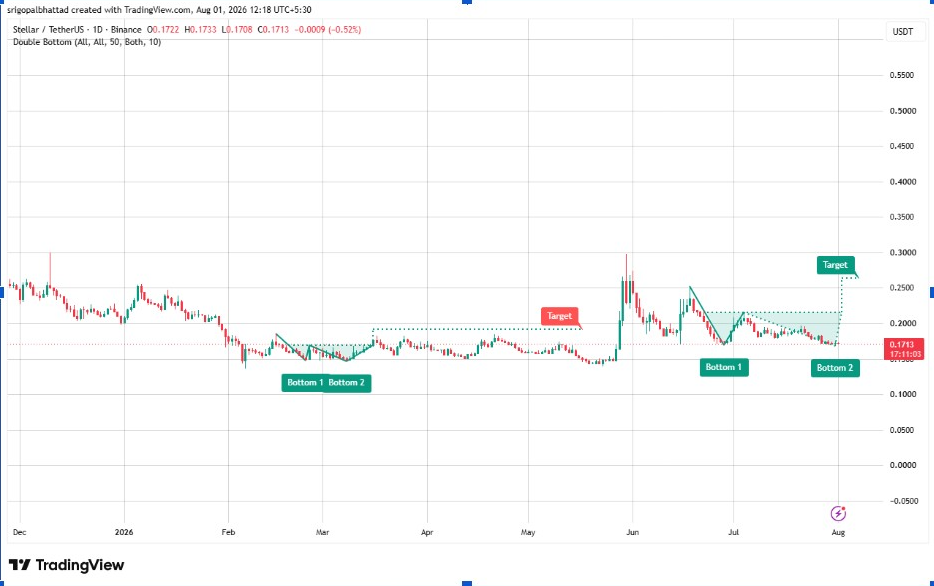
The first low formed near the end of June after XLM declined from the $0.24 region. Price later recovered toward $0.22 before sellers regained control and pushed it back toward support.
Buyers are now attempting to protect the second bottom around $0.17. A sustained rebound would preserve the pattern and increase pressure on the neckline between $0.21 and $0.22.
A confirmed breakout above that resistance could open a recovery toward $0.27–$0.28. Nevertheless, losing $0.17 would weaken the formation and expose lower support near $0.15.
XLM Crypto Accumulation Score Reaches Extreme Reading
Meanwhile, analyst CW highlighted an accumulation score of 100 out of 100 on XLM’s one-hour chart. The indicator classified current conditions as extreme accumulation.
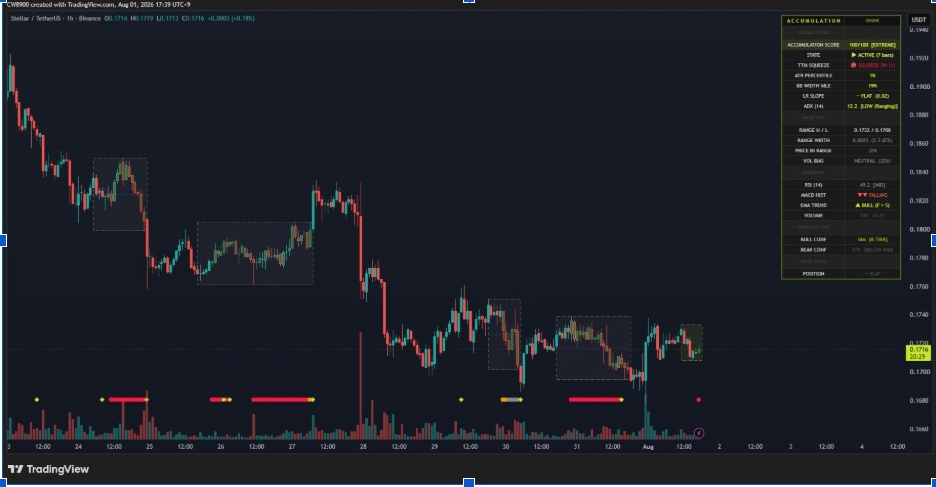
Price is compressed inside a narrow range between approximately $0.1708 and $0.1733. The setup also indicates a seven-bar active squeeze on the accompanying chart, which is very low volatility.
The average true range percentile sits near 1%, while the Bollinger Band width ranks near 19%. For short-term movement, the reading has been reduced significantly in this reading.
Additionally, trading volume is only about one-quarter of its recent average. RSI sits near 49, while the ADX reading of 12.2 confirms a weak directional trend.
The indicator gives bulls a 36% confidence reading against 27% for bears. Even so, a falling MACD histogram shows buyers still need stronger momentum before a breakout.
Long-Term Cycle Charts Show Familiar Base
Notably, Laura-Vers compared the current XLM structure with two earlier market cycles. Both previous cycles started after price formed an extended base near long-term support.
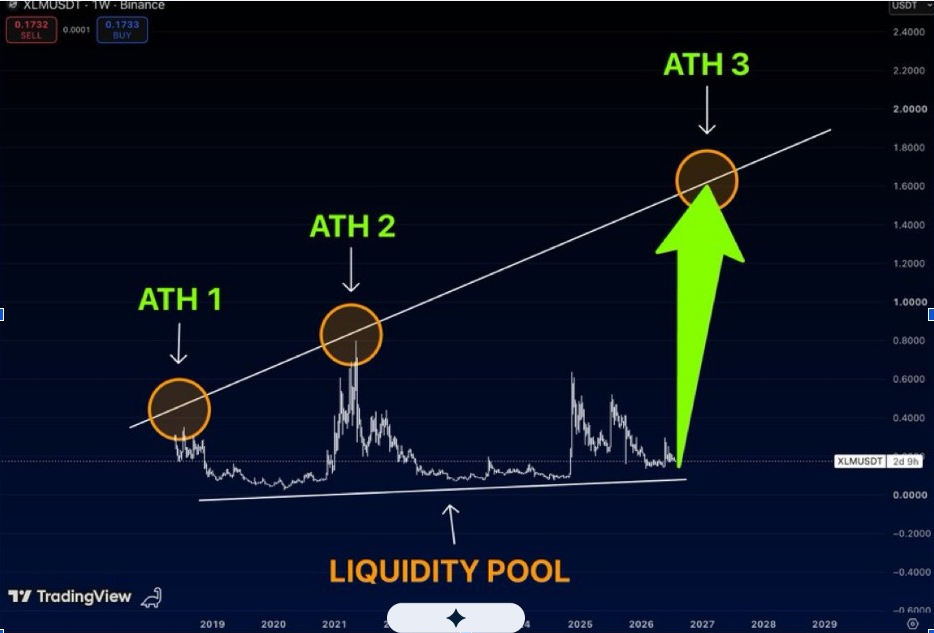
The weekly chart shows major rallies during 2018 and 2021. Each expansion followed a prolonged period of sideways trading near what the analyst labels a liquidity pool.
XLM crypto now trades near the lower section of the same broad structure. An ascending resistance line connects the peaks from the two previous cycles and extends into 2027.
The chart places a speculative third-cycle target near $1.60–$1.80. However, that projection depends on XLM repeating earlier cycle behaviour over a much longer timeframe.
Support near the historical accumulation area offers a constructive foundation. Yet price must clear several resistance levels before the projected third record high becomes technically relevant.
Analysts Map $0.22 and $0.65 Breakouts
Elsewhere, MikybullCrypto presented a three-month chart showing XLM holding a rising support line established after the 2017 breakout. Price now sits near that trendline at roughly $0.17.
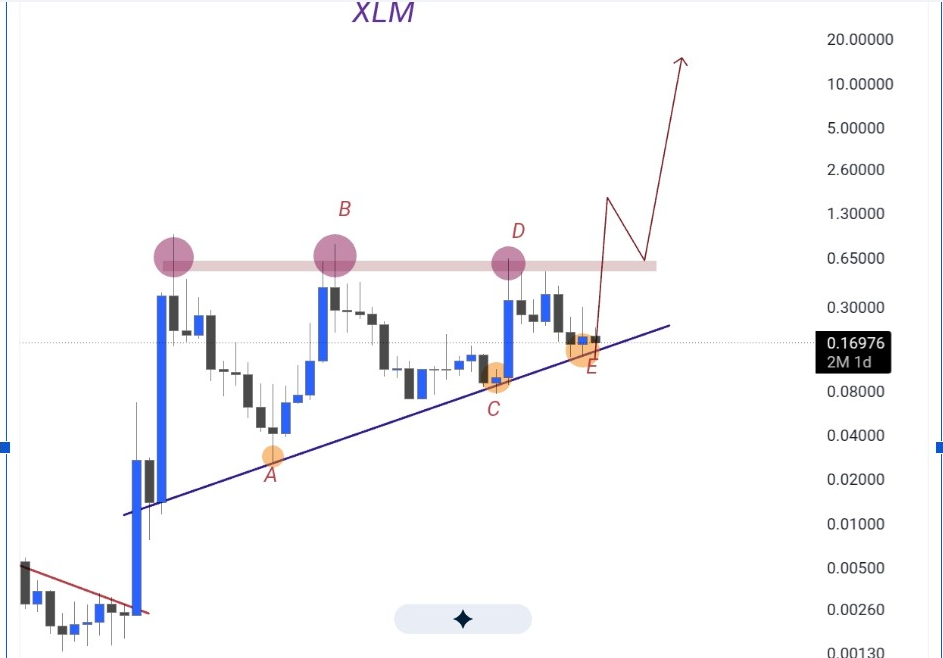
The broader pattern also features major peaks near $0.60–$0.65. Those highs create horizontal resistance across several market cycles, forming a long-term ascending structure.
A recovery above $0.22 would provide the first confirmation on lower timeframes. Bulls would then face resistance around $0.28, $0.30 and the broader $0.60–$0.65 supply zone.
Moreover, a decisive break above $0.65 would change the long-term market structure. MikybullCrypto’s chart projects a strong expansion after that breakout, with considerably higher targets shown on its logarithmic scale.
Still, the larger projections remain conditional rather than confirmed. XLM first needs to protect $0.17, escape its narrow range, and reclaim the daily neckline near $0.22.