
 Doge Pepe
 Optimism
 Pearl
Pearl Quantus
 Bitway
 Pons
Pons NEAR Protocol

Bitcoin selling pressure is showing signs of exhaustion as BTC remains range-bound near $63,000. However, on-chain indicators suggest sellers have not reached levels associated with previous Bitcoin bottoms.
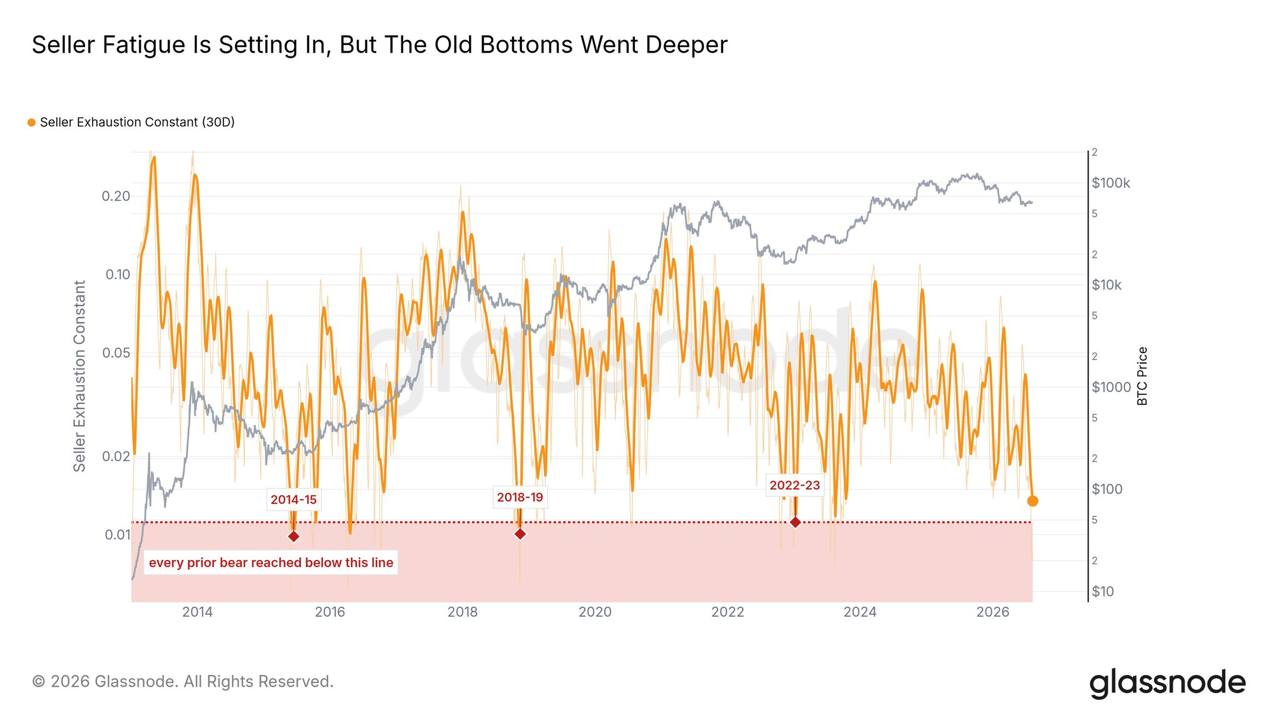
Glassnode’s Seller Exhaustion Constant has fallen below 0.02 as selling pressure weakened. Crypto analyst Antifragile noted that previous Bitcoin bear markets pushed the indicator below 0.01 before establishing major bottoms.
The current reading therefore suggests seller exhaustion is developing without confirming a cycle low.
Bitcoin Sellers Approach Historical Exhaustion Levels
The clear evidence that the sellers are still active is the Long-Term Holders (LTH) balance, which has been declining. According to CryptoQuant data, the LTH balance continues to trend downward despite the recent surge in accumulation.
Crypto analyst Rei Reseacher noted that this shows some LTH are still selling, and that accumulation is not strong enough to reverse the decline in the total value of BTC held by this cohort.
“The amount of $BTC aging into the Long-Term Holder cohort is still not enough to offset the coins leaving it,” he said.
However, it is not just LTHs who are distributing Bitcoin. Even short-term holders (STH) are selling at a loss, with analyst Ja Maartun noting that STHs moved around 19,200 BTC to exchanges over the past 24 hours.
Bitcoin Price Remains Trapped Below $65,000
Bitcoin price action reflects the mixed on-chain setup. BTC has traded mainly between $60,000 and $65,000 since June, with repeated attempts to establish a stronger recovery failing near the upper boundary.
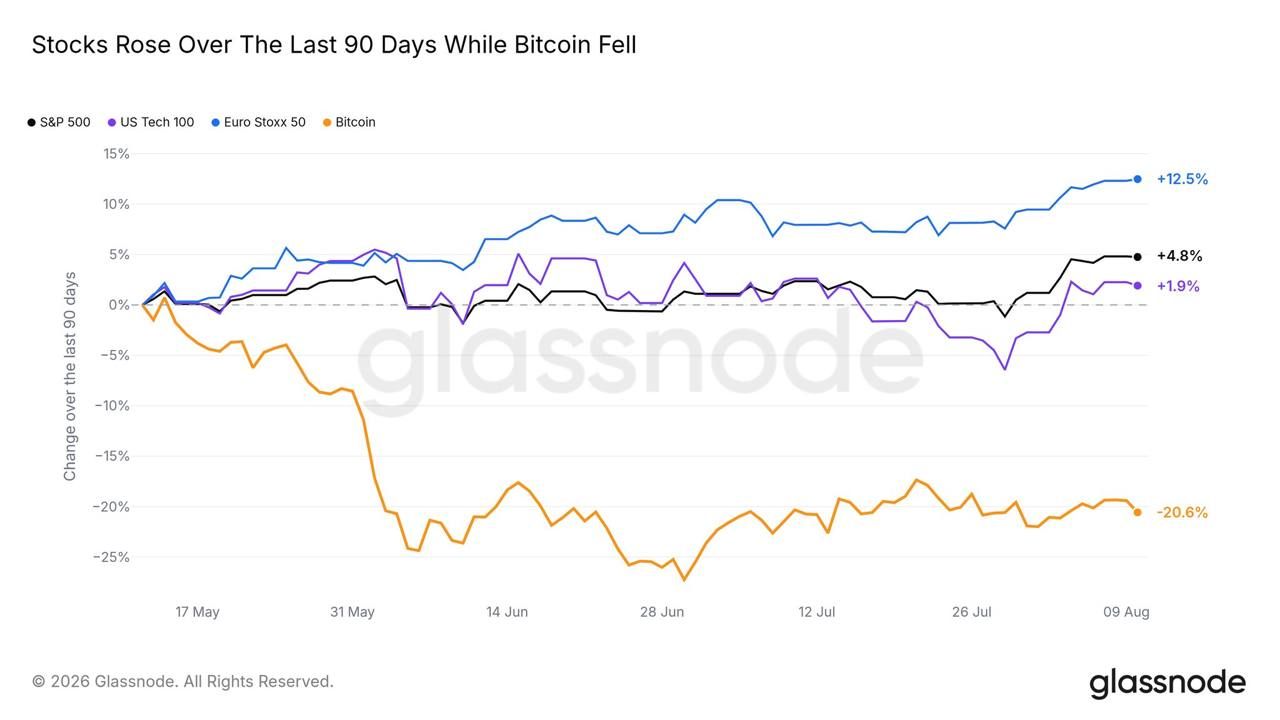
Bitcoin briefly approached $65,000 before falling back toward $63,000 during the latest correction. The decline left BTC approximately 27% lower year to date based on the supplied market data. Bitcoin has therefore underperformed major U.S. equity indexes during 2026.
The S&P 500 gained approximately 12.8% year to date in the supplied comparison. The Dow Jones Industrial Average gained 11.9%, while the Nasdaq 100 advanced 13.7%.
The Russell 2000 posted the strongest performance among the four indexes, rising approximately 22%. The divergence also remained visible over shorter periods.
Bitcoin fell approximately 20% during the previous 90 days. The S&P 500 gained about 5% during the same period, while the Nasdaq advanced approximately 1.9%.
Those figures show capital favoring U.S. equities over Bitcoin despite volatility across technology stocks.
Bitcoin Price Faces CPI Test
Attention now turns toward the July U.S. Consumer Price Index report. The U.S. Bureau of Labor Statistics scheduled the report for Aug. 12 at 8:30 a.m. Eastern Time.
The previous report showed headline inflation increased 3.5% during the 12 months through June. Core inflation, which excludes food and energy, rose 2.6% over the same period.
The July reading could influence expectations for Federal Reserve interest-rate policy.
A stronger-than-expected inflation reading could strengthen expectations for tighter monetary policy. That scenario could pressure Bitcoin and other risk assets.
Softer inflation could produce the opposite reaction by reducing pressure on the Federal Reserve to maintain restrictive policy.
However, CPI alone will not determine Bitcoin’s longer-term direction. Traders will also track labor-market conditions, Federal Reserve guidance and institutional demand.
For Bitcoin, the on-chain picture remains mixed before the inflation report.
Seller exhaustion has increased, but the Glassnode indicator remains above levels associated with previous bear-market bottoms. Long-term and short-term holder distribution also suggests selling has not disappeared.
That leaves the Bitcoin bottom thesis unconfirmed while BTC remains inside its $60,000-$65,000 trading range.
Disclaimer: This article is for informational purposes only and does not constitute financial or investment advice. Cryptocurrency markets are highly volatile. Readers should conduct their own research or consult a licensed financial professional before making investment decisions.





