
 Pearl
Pearl Bitway
 Pudgy Penguins
 Optimism
 Walrus
 NEAR Protocol
 Pons
Pons

Ethereum price traded near $2,513 on Sept. 14 after recovering above the $2,500 level. ETH remains up about 60% during the third quarter despite retreating from its recent push toward $2,600.
The rebound followed two weak quarters earlier this year. ETH fell 29.26% in Q1 and another 25.28% in Q2 before reversing higher during the current quarter.
Traders now focus on the $2,550 resistance area ahead of the Federal Reserve decision. A weekly close above that zone could strengthen the recovery, while failure to hold $2,500 would keep lower support levels in focus.
Ethereum Price Prediction: $2,550 Close in Focus
Ethereum price is testing a key weekly area after reaching a session high near $2,666. ETH crypto later moved back below $2,600, while the weekly candle trades near $2,494.76. The $2,550 region now forms the nearest barrier. A weekly close above that area would return price above the 50-week simple moving average near $2,511.
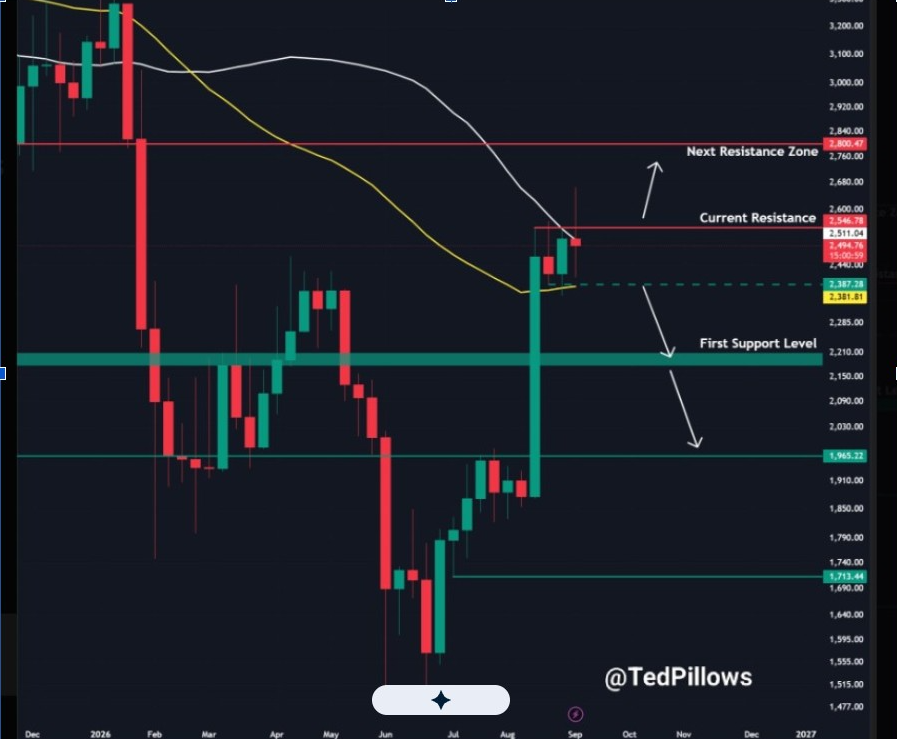
The next marked upside zone sits near $2,800.47 if buyers regain control above $2,550. On the downside, the 50-week exponential moving average stands near $2,381.81. Price also has a nearby reference level around $2,387. A deeper pullback would bring the $2,210 area into focus before the lower support near $1,965.22.
Q3 Gain Reaches 60.62% After Weak First Half
Ethereum’s price has risen 60.62% so far in Q3, its second-best third-quarter performance in Coinglass data. Only Q3 2025 produced a stronger result, when ETH crypto gained 66.55%. The current advance also sits well above the historical Q3 average of 12.28% and median return of 9.87%.
Ethereum lost 29.26% in Q1 and another 25.28% in Q2 before reversing higher during the current quarter. ETH gained 59.5% in Q3 2020 and 31.86% in 2021, while it lost 48.69% in 2018. Q3 also produced losses of 37.43% in 2019, 24.19% in 2024, and 13.64% in 2023.
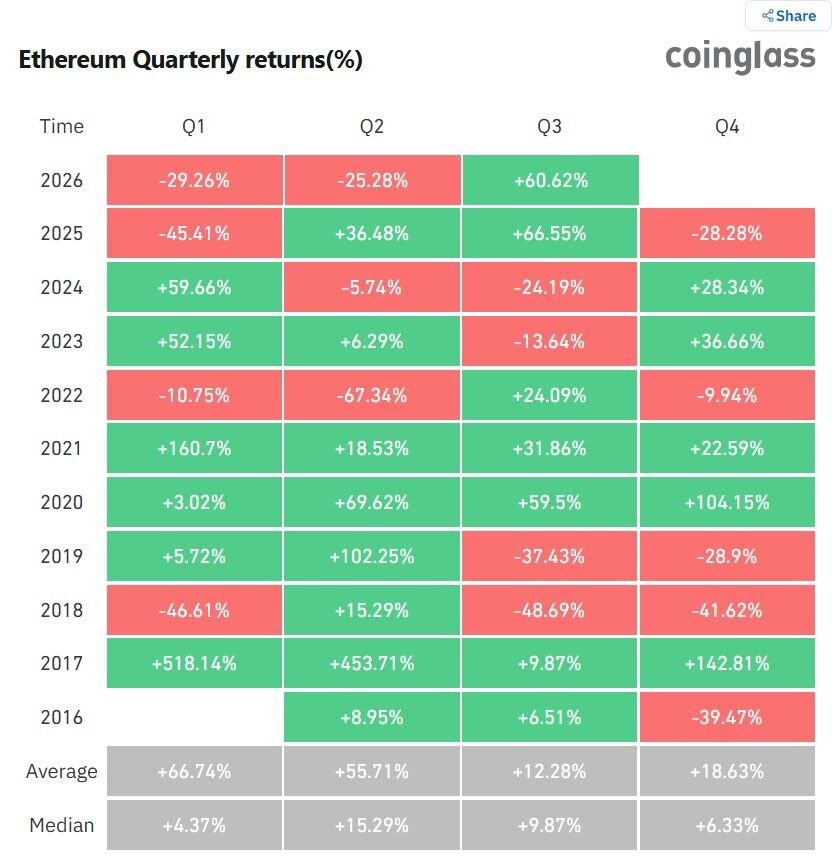
The 2026 move therefore, ranks near the top of Ethereum’s third-quarter history, but the quarter has not ended. Current performance reflects returns through the latest session, not the final quarterly close. Price action over the rest of September will determine the completed Q3 figure.
ETH Crypto Pullback Tracks Leverage Unwind
The latest Ethereum decline has developed during thin weekend liquidity and heavy position clearing. Market data during the move points to leverage unwinding as a larger driver for ETH than direct spot selling. That differs from Bitcoin, where the aggregated spot cumulative volume delta has continued to fall in recent sessions.
Bitcoin spot CVD dropped toward 4.503K as BTC traded near $76,783. The measure has trended lower since early September, even as Bitcoin moved through several short rebounds. ETH crypto, by comparison, has faced more pressure from leveraged positions. That distinction keeps spot activity and derivatives positioning central to the next short-term move.
Weekend trading also produced sharp position exits. Low volume can amplify moves when traders carry leveraged exposure into major events. Some Bitcoin shorts also appeared during the same period, while broader market activity stayed weak after Friday’s brief squeeze.
Ethereum price now trades close to both major weekly moving averages. The 50-week SMA sits near $2,511.04, while the 50-week EMA holds lower near $2,381.81. ETH crypto must recover to a higher average and close above the $2,550 level to strengthen the current Q3 recovery structure.




