
 Sword Inu
 streamoors
 Altai the Tiger
 no crying in the casino
 IGNITION
 Pudgy Penguins
 Quantus

Key Highlights:
- SHIB Key Support Levels $0.000012 and $0.0000094 are crucial for price stability
- Bearish Market Conditions Indicators suggest potential reversal if momentum shifts
- Investor Sentiment 85.41% of SHIB holders remain at a loss
Shiba Inu price is at a critical turning point as it tests major support at $0.000012 and $0.0000094. Analysts suggest that holding these levels could lead to recovery, while failure may trigger further declines. Key technical indicators hint at potential price movements ahead.
The token currently stands at critical support points which will shape its future market trajectory. Since late 2021, the SHIB token has experienced a major price decline which continues to draw attention from market analysts. Crypto analyst Ali Charts has marked $0.000012 and $0.0000094 as essential price points for market movement.
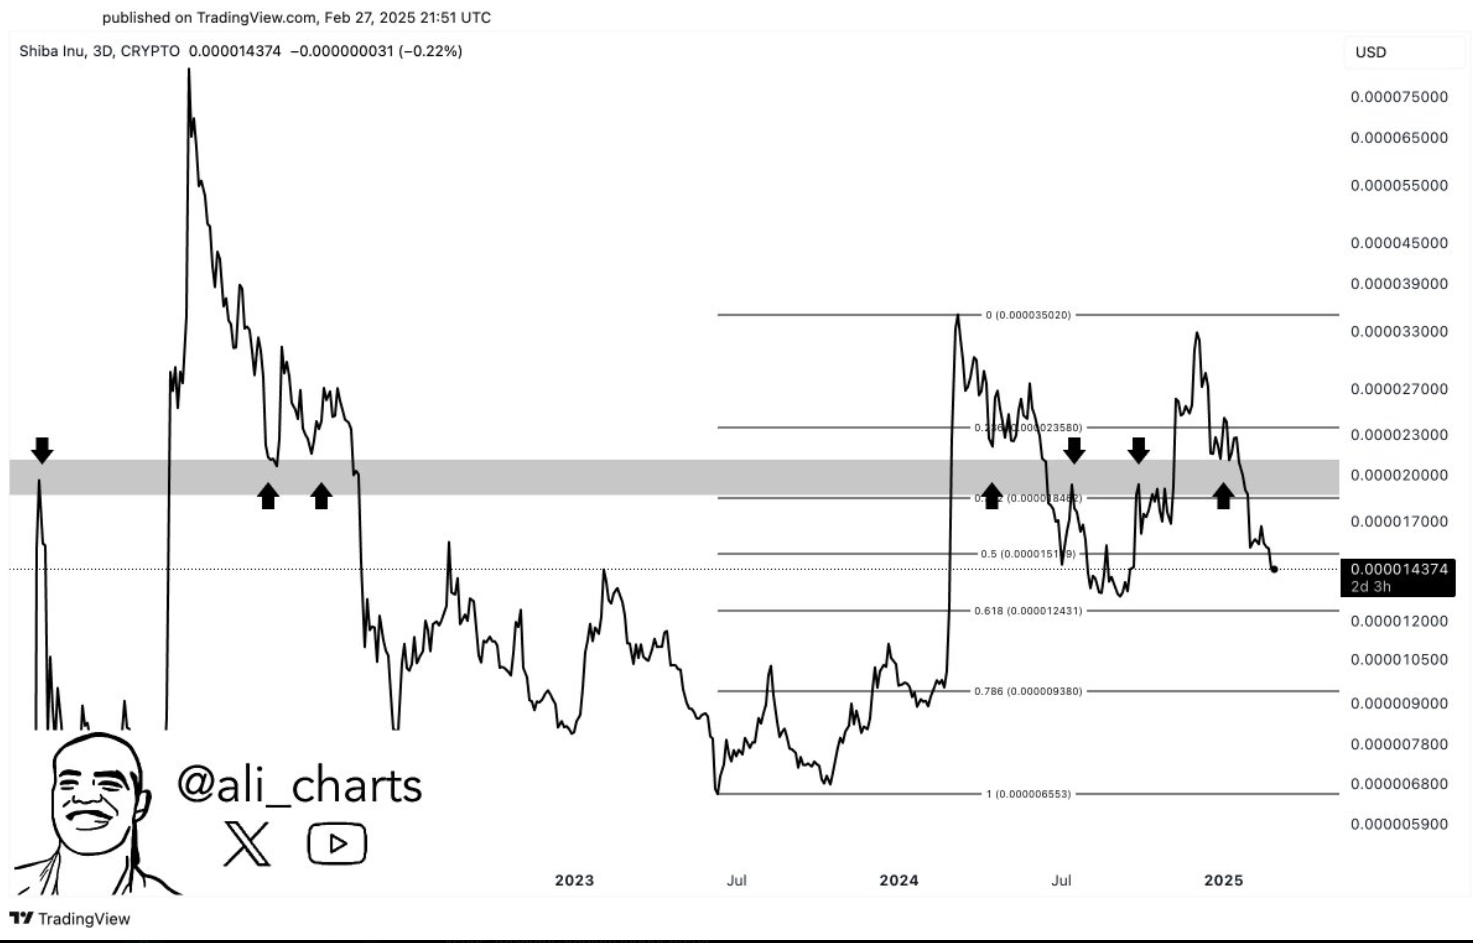
Previous trading cycles demonstrate that these price levels functioned as psychological barriers according to historical data. A stabilization of SHIB price at these support levels would indicate the start of a potential market recovery.
However, the bearish trend will strengthen if SHIB breaks through its support levels.
The market analysts agree that maintaining price stability at these levels creates potential conditions for upward price movement. The success of SHIB depends on its ability to sustain these price points because any failure to maintain support could lead to additional market declines that shape future market trends.
SHIB Key Indicators Show Potential for Reversal
The current price of Shiba Inu stands at $0.00001384 with a 4.84% decrease in the last 24 hours, with technical indicators pointing toward bearish market conditions.
Ichimoku Cloud analysis shows SHIB continues to face selling pressure because it stays below essential resistance areas. The price continues to decline according to the blue Tenkan-sen line and red Kijun-sen line.
The widening distance between the Ichimoku Cloud and the current price indicates a reduction in downward market pressure. Meanwhile, trading activity shows a minimal rise according to the Volume Oscillator (5 10) which reports 1.89%.
Despite this rise, the increase in trading volume does not reflect increased market volatility because traders show little commitment to either side of the market.
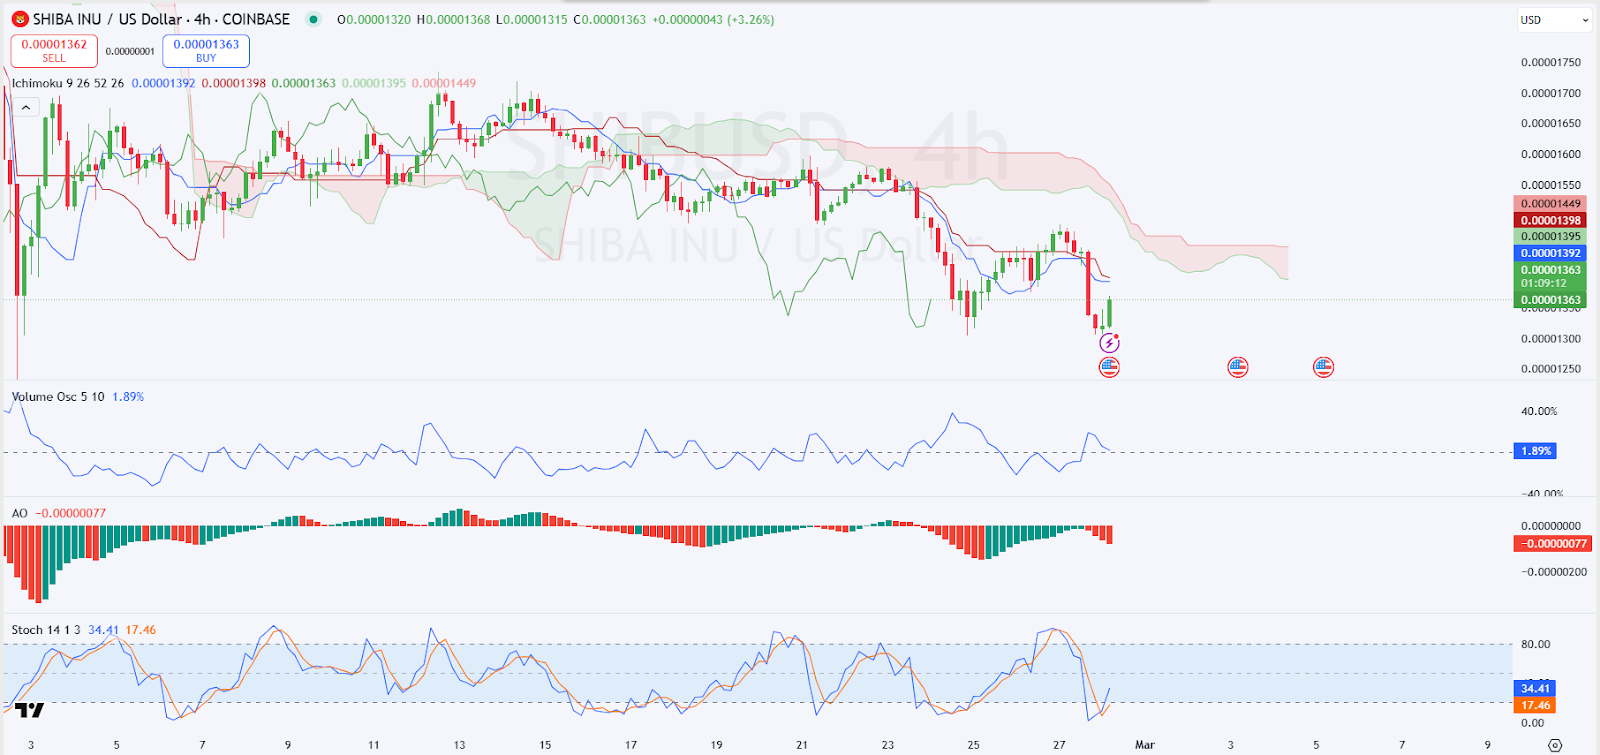
The Awesome Oscillator (AO) shows -0.00000077 as its current reading which indicates negative momentum through its predominantly red histogram.
The Stochastic Oscillator (14 1 3) shows 34.41 which indicates potential oversold conditions while its orange line stands at 17.46. The current market position of SHIB indicates potential price reversal when market conditions improve, thus making it essential for traders to monitor this point.
What are the Key Levels as per Shiba Inu Price Exchange Liquidation Map?
The OKX Exchange liquidation map for Shiba Inu price displays essential price points which influence trader positions. The current price shows pressure from both long and short liquidations. Short liquidations trigger trader position coverages when prices increase according to the green line on the chart.
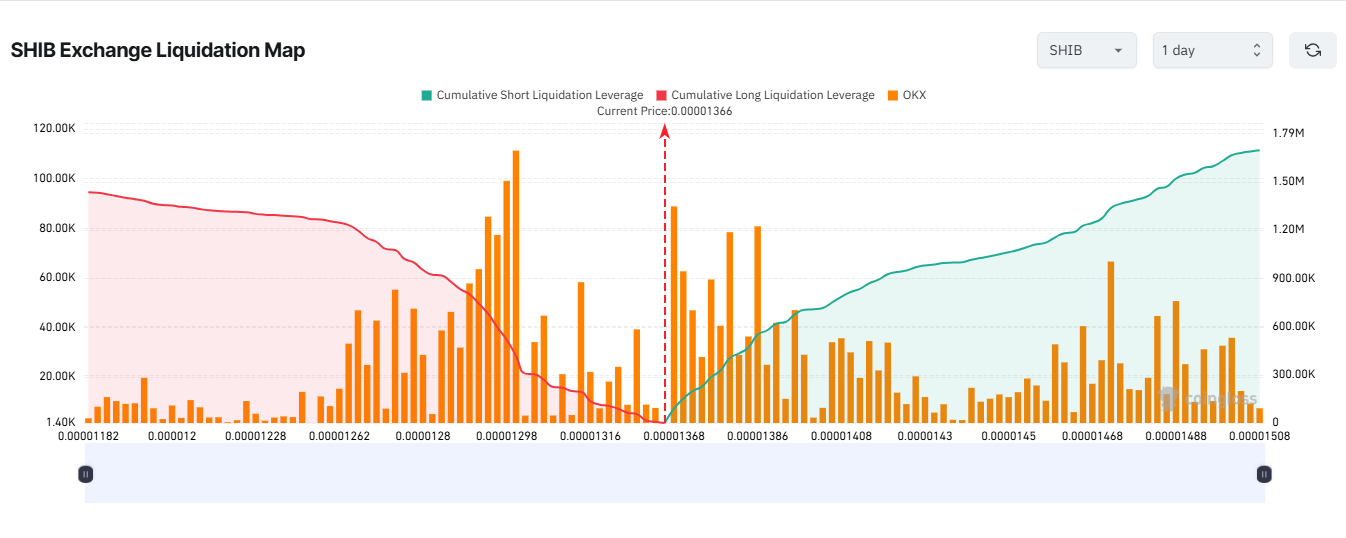
Short liquidations increasing in the market could boost SHIB prices as traders need to repurchase tokens to avoid losses. Conversely, the red line, which represents long liquidations, demonstrates risk at $0.000014 and $0.000015 price levels.
The size of orange bars in the chart indicates the risk level for long traders who might need to sell their positions when prices drop.
Market participants demonstrate conflicting views through their trading activities near important resistance levels. SHIB may rise through additional short liquidations at its current level or break above $0.000014.
However, a price decrease would trigger additional liquidations of long positions, which would create further downward pressure on the token.
Analyzing SHIB Trader’s Market Position
According to data from Intotheblock, the majority of Shiba Inu investors are currently facing losses. At the current price, a significant percentage of holders are “Out of the Money. The 841.04 trillion SHIB tokens make up 85.41% of the total holdings.
The investor group labeled “In the Money” maintains ownership of 143.01 trillion SHIB tokens which represent 14.52% of the total investor base. The “At the Money” category represents only 0.06% of addresses, indicating that traders in this group have achieved minimal profit or loss.
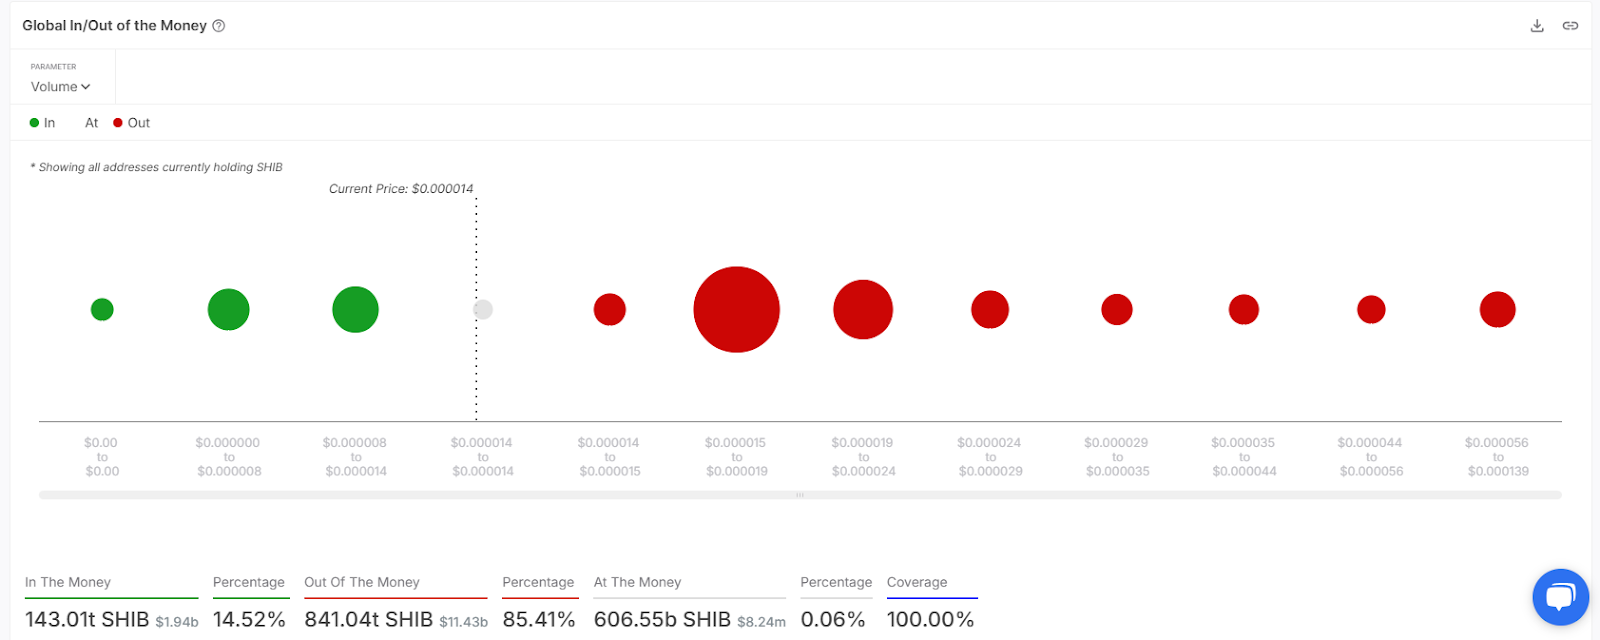
Majority of SHIB investors require a price increase to become profitable based on current data. A positive shift in market sentiment would lead to SHIB recovery as traders would return to the market.
The prolonged market consolidation or additional Shiba Inu price drop will likely result in most investors remaining in a losing position, which will strengthen bearish market sentiment.
Disclaimer
This article is for informational purposes only and provides no financial, investment, or other advice. The author or any people mentioned in this article are not responsible for any financial loss that may occur from investing in or trading. Please do your research before making any financial decisions.




