
 NEAR Protocol
 Bitcoin
 Aerodrome Finance
 Pearl
Pearl Uniswap
 Quantus
 Pudgy Penguins
Key Insights:
- DOGE fell over 70% in 3 months, dropping from $0.48434 to a low of $0.14280.
- A weekly doji candle hints at a potential trend reversal for Dogecoin.
- Trader Tardigrade predicted a rally, targeting $0.95 within an ascending channel.
Dogecoin (DOGE) price has dropped over 70% in three months, falling from $0.48434 to $0.14280. However, a newly formed doji candle on the weekly chart suggests a potential price reversal.
Dogecoin Price Forms a Doji on the Weekly Chart
Well-known analyst Trader Tardigrade has highlighted a doji candle on the weekly candlestick chart of DOGE price. A doji forms when an asset’s opening and closing prices are nearly identical.
This candlestick pattern signals market indecision, where neither buyers nor sellers establish clear control.
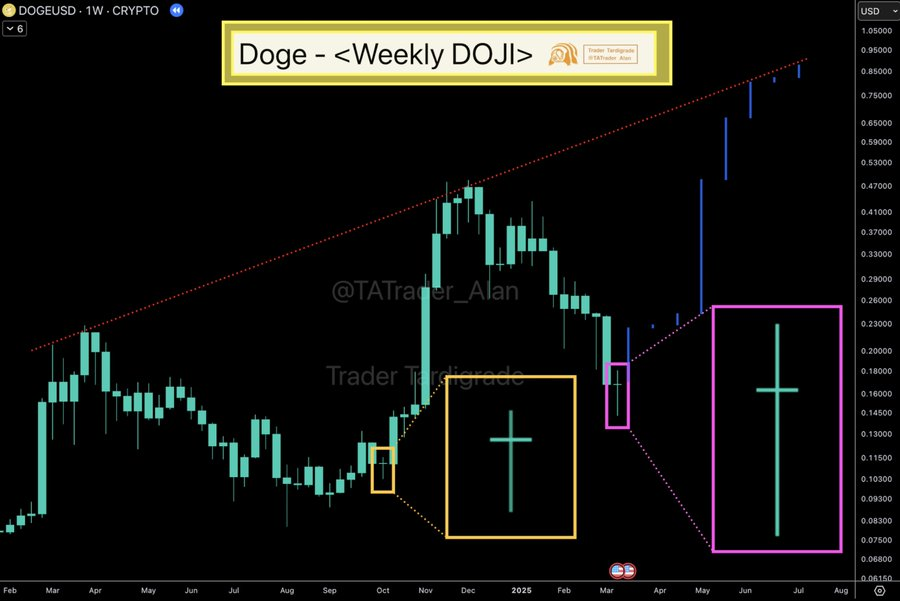
A doji is a neutral pattern on its own. However, it can indicate a shift in market sentiment when it appears after a strong trend. In Q4 2024, a similar doji candle on Dogecoin price chart preceded a 240% rally.
The token could be gearing up for another significant surge if this pattern continues. The recent doji formed last week as DOGE opened at $0.16810 and closed at $0.16817.
This small price difference indicates that selling pressure has weakened, creating the possibility of a bullish reversal. If demand increases, the memecoin could enter an upward trajectory similar to previous rallies.
Dogecoin Price Bulls Target a Breakout Toward $1
Trader Tardigrade believes that Dogecoin price is on the verge of another major rally. The analyst has shared a price target of $0.95. This suggested that the top altcoin’s price could follow an ascending channel pattern.
This formation often signals a sustained uptrend, with higher highs and higher lows forming over time. Dogecoin traded at $0.1730 when writing, reflecting a 3% decline on the day.
Despite this short-term drop, bullish traders remain focused on key resistance levels. If DOGE reclaims higher price levels, momentum could build, pushing the asset toward its next major target.
Market sentiment will play a crucial role in memecoin’s potential breakout. Historically, Dogecoin price has experienced rapid surges following significant technical signals.
If bullish volume increases, the meme coin could challenge its previous highs and attempt to reach the long-anticipated $1 milestone.
Key Resistance and Support Levels to Watch
According to technical factors, DOGE has to break through $0.20 to ensure a breakout. A rise past this level could suggest a higher swing potential toward $0.30. The $0.25 level is another major resistance level where sell pressure can build to slow down the bullish trend.
On the flip side, Dogecoin price will need to maintain a $0.16 base to avoid more losses. The price may be unable to move above this level. If this happens, bearish pressure may rise again and the lowest level of $0.14 might be tested again.
For the price to continue upward, Dogecoin must keep touching higher lows. Such a breakout would affirm Trader Tardigrade’s target of higher prices.
If DOGE price is to follow history, it may be gearing up for an upward movement shortly. Cryptocurrency traders and investors are closely observing candlestick patterns. They aim to determine whether a Doji pattern might trigger another price surge.
Disclaimer
This article is for informational purposes only and provides no financial, investment, or other advice. The author or any people mentioned in this article are not responsible for any financial loss that may occur from investing in or trading. Please do your research before making any financial decisions.



