
 Zylo Ecosystem
 astronaut
 Pearl
Pearl Walrus
 Starknet
 Pudgy Penguins
 Bitcoin

Key Insights:
- Analysts highlight Bitcoin‘s historical cycle, suggesting it is in a strong bullish phase.
- Market patterns indicate Bitcoin could see significant gains before the next downturn in 2026.
- Bitcoin’s price fluctuations align with past trends, signaling a potential continued upward trend.
Bitcoin’s price movement remained sluggish over the weekend, hovering around $84,000 after a volatile week influenced by the Federal Reserve’s inaction and Ripple’s partial legal victory against the SEC. As Sunday ended, Bitcoin began gaining traction, continuing its upward movement on Monday.
It almost touched $89,000 level, which it has not witnessed in several weeks as it nosedived. It started fluctuating, trying to reverse the loss repeatedly only to reverse and decline. In recent hours, Bitcoin fell below the lower boundary of its weekly range, fluctuating between $86,000 and $89,000, and now faces challenges staying above $84,000.
Analysts Maintain Optimism in Bitcoin Price
As per expert analysts, technical aspects suggest that Bitcoin (BTC) price will continue to perform progressively up later on.
Despite the recent downturn, technical analysts remain positive about Bitcoin’s long-term trajectory. One analyst, Mags, noted that Bitcoin follows a four-stage pattern across its past three cycles: bottoming out, recovery, an upward phase, and a bear market.
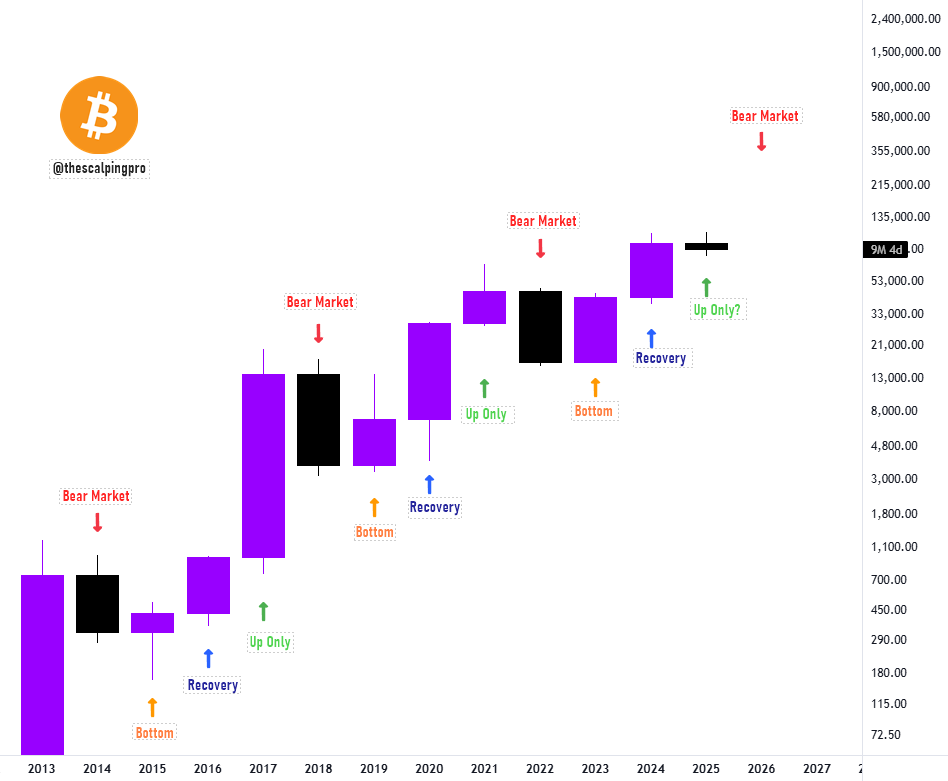
Indeed, the price of Bitcoin forms a low in a bear market then has the potential to rise to a new local top in the recovery phase. The following “Up Only” year leads to a highly likely price increase before the next bear market appears.
Continuing in this historical perspective, Mags claimed that Bitcoin has not yet formed the expected green candle in the “Up Only” phase. From past cycles, it can be observed that the yearly candle always close up higher than the previous year. The chart has illustrated that the possible trajectory of BTC means it could reach $200,000 before the end of the year and a bear market may start in 2026.
Bitcoin Key Support and Resistance Levels
Glassnode’s analysis of Bitcoin’s cost basis distribution revealed notable investor behavior. Efficient traders purchased nearly 15,000 BTC at the $78,000 low on March 10 and later sold at the local top of $87,000. With reduced Bitcoin holdings at the $78,000 mark, support at this level appears weaker.
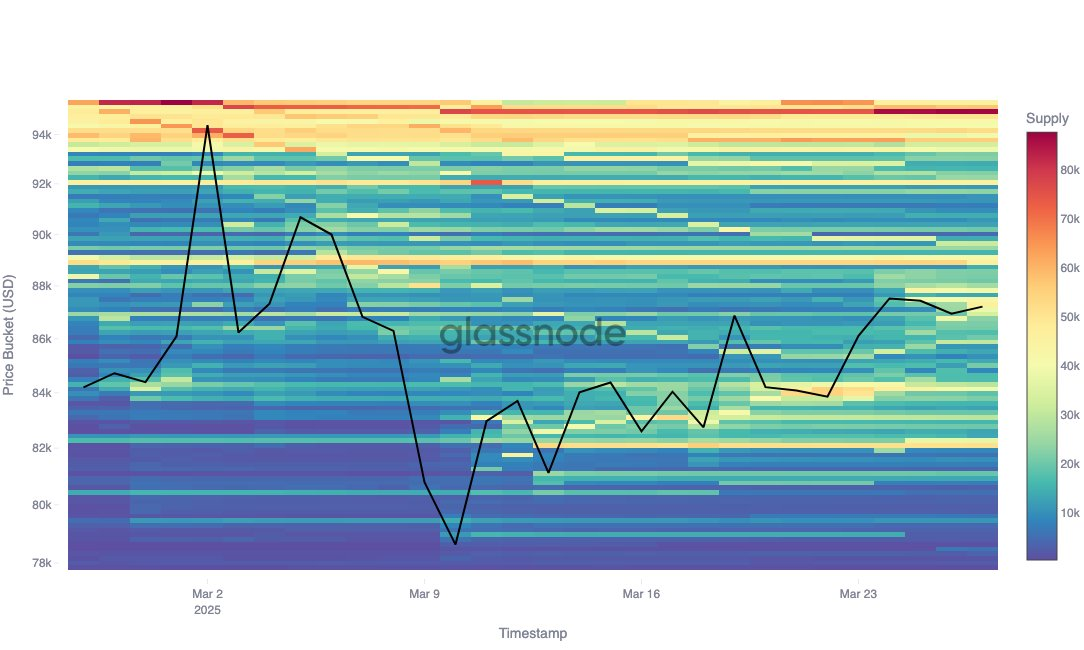
Current support clusters have formed at multiple price points. Around $84,100, approximately 40,000 BTC serve as support, while $82,090 holds about 50,000 BTC. Additionally, $80,920 sees a support level of around 20,000 BTC. Meanwhile, resistance appears to be consolidating at $95,000, where investor cost basis clusters increased by 12,000 BTC since March 24.
If Bitcoin’s correction intensifies, longer-term cost basis data identifies deeper structural support zones. The $74,000 level holds approximately 49,000 BTC, while $71,000 sees around 41,000 BTC.
Bitcoin ETF Inflows and CME Gap Retesting
On its hand, CryptoRank reported continuous inflows into Bitcoin ETFs over the past ten days, accumulating $1.06 billion since March 14.
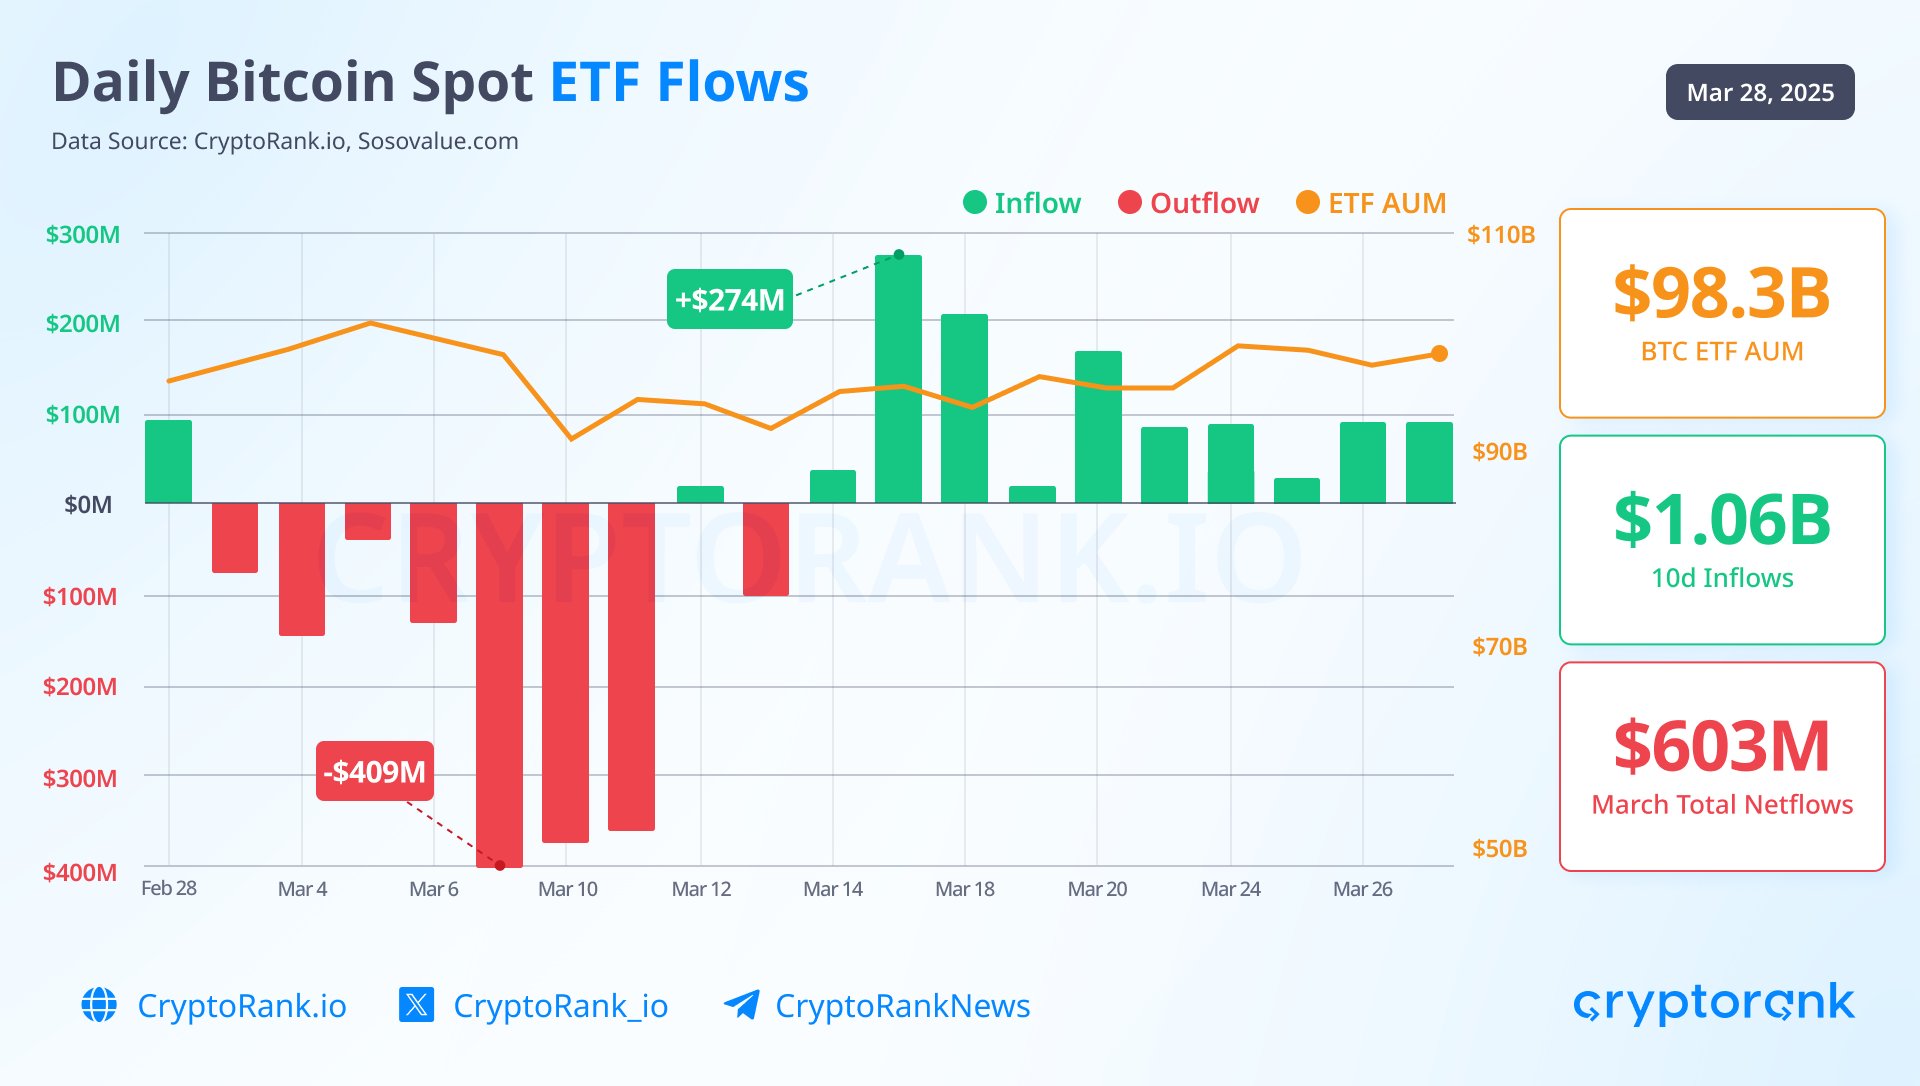
Assets under management have increased, rising from $88 billion on March 10 to $98.3 billion. At the same time, March is on track to become the second-largest month for outflows after February, surpassing April’s $345 million in outflows.
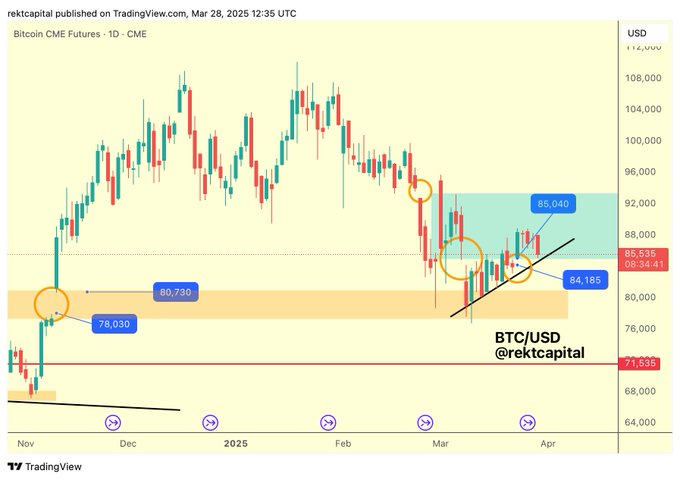
Rekt Capital observed Bitcoin’s recent price movements in relation to the CME Gap. The asset has started retreating toward a previously identified gap between $82,000 and $85,000. Bitcoin has only begun testing this area, and analysts suggest that a successful retest could serve as a foundation for potential upward movement.
Disclaimer
This article is for informational purposes only and does not provide any financial, investment, or other advice. The author or any people mentioned in this article are not responsible for any financial loss that may occur from investing in or trading. Please do your research before making any financial decisions.




