
 streamoors
 IGNITION
 Injective
 NEAR Protocol
 Quantus
 Pearl
Pearl Aerodrome Finance

Key Insights:
- Pepe coin dropped to $0.0000070 after failing to break above the 50-day EMA, signaling strong bearish resistance.
- Five new wallets acquired 611 billion Pepe tokens worth $4.28M 15 days ago, funded with ETH from Tornado Cash.
- PEPE price eyeing 0.382 Fib, which could lead to a $0.000014 target.
Pepe coin price is once again at the center of market attention following a recent pullback and unusual whale accumulation. The top meme coin dropped to $0.0000070 in 24 hours amid challenges to maintain its recent bullish run.
Similarly, meme coins have faced market weakness recently, causing both Dogecoin (DOGE) and Shiba Inu (SHIB) to decline in value. Despite the meme coin crash, recent market data revealed that five new wallets purchased 611 billion Pepe tokens worth $4.28 million based on current market rates.
New Wallets Buy 611 Billion Pepe Coin Tokens, What’s Happening?
According to on-chain data, five newly created wallets have acquired a total of 611 billion Pepe tokens. These acquisitions occurred within the past 24 hours. The total value of the purchased tokens was approximately $4.28 million based on the current rates.
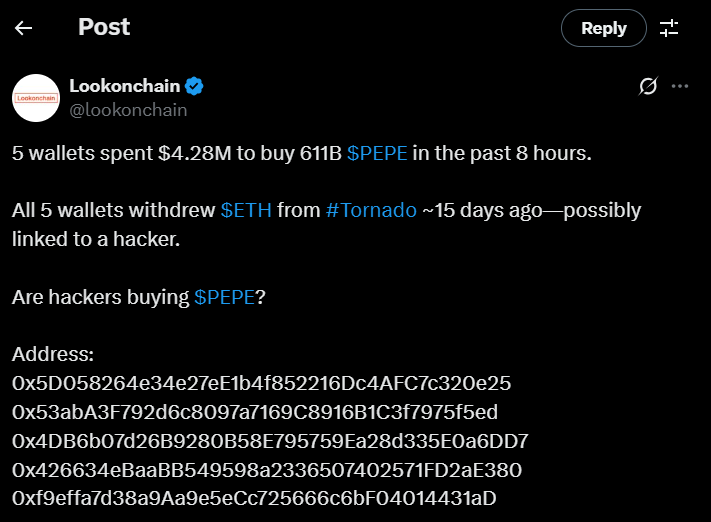
What makes these transactions notable is the origin of their funding. Each wallet received ETH funding 15 days ago through Tornado Cash, a decentralized privacy tool for cryptocurrency transactions.
The use of Tornado Cash as the funding source has raised questions within the community about the intentions behind the purchases. While there is no confirmed link to illicit activities, the combination of large-scale accumulation and anonymous funding has created speculation.
As a result, investors are closely monitoring these wallets for any signs of coordinated activity or unusual movement that could influence Pepe coin price prediction.
Pepe Coin Price Technical Indicators Signal Bearish Pressure
Pepe Coin’s latest price drop follows a failed attempt to sustain a bullish breakout above a falling wedge pattern. The token encountered resistance at the 50-day Exponential Moving Average (EMA) throughout late March until now.
Notably, PEPE price achieved its weekly peak at $0.0000077 before meeting resistance that triggered its reversal toward a former resistance trendline. The current price patterns indicate a future test of this trendline could form short-term support near that zone.
More so, PEPE faces potential price decline to $0.0000062 because this level corresponds to a crucial support area that was previously broken. A successful retest could stabilize the price, but if sellers gain control, a further decline toward $0.0000050 remains a possibility.
$2.63 Million Long Liquidation Risk and Derivatives Data
As volatility increases, open interest in Pepe futures has decreased by 12%, now standing at $282.9 million. Despite the decline, the funding rate has turned positive, reaching 0.0063%. This suggests more traders are opening long positions, expecting a price recovery.
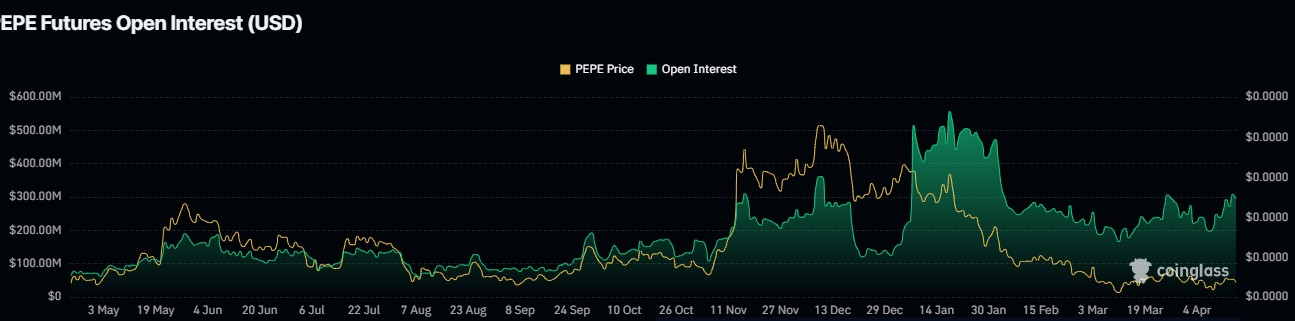
The percentage of long positions rose to 59.2% over the past 12 hours, with the Long/Short Ratio reaching 0.9183, indicating a near-equal distribution of bullish and bearish sentiment.
Currently, long positions dominate at 55.9%, according to the latest derivatives data. This rising optimism, however, brings with it a risk of liquidation. If Pepe price falls to $0.00000689, a large-scale liquidation of approximately $2.63 million in long positions could occur. This might result in further downside pressure and lead to the realization of the lower support levels.
Next Price Targets: $0.0000050 or $0.000014?
Technical analysis points to two potential paths for Pepe coin, depending on upcoming market behavior. If the current downward trend continues, price targets include $0.0000062 for support testing and $0.0000050 in the event of failed support. These levels align with key structural zones previously identified on the daily chart.
On the upside, analysts have identified the 0.382 Fibonacci retracement level as a possible short-term target. This level sits at approximately $0.000014, based on the recovery from recent lows. Historical chart patterns suggest that this zone is crucial during trend reversals. If market sentiment improves and volume returns, Pepe could make a move toward this resistance.
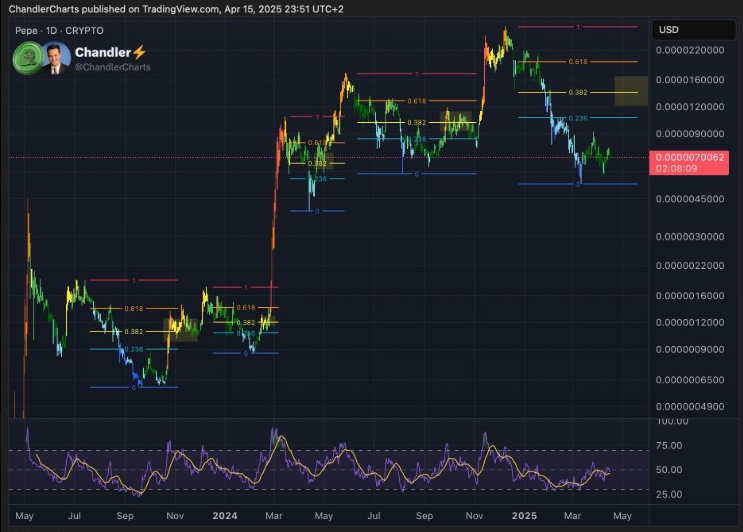
The Relative Strength Index (RSI) is hovering between 45 and 50. A breakout above 50 with rising volume could trigger bullish momentum toward resistance.
Disclaimer
This article is for informational purposes only and provides no financial, investment, or other advice. The author or any people mentioned in this article are not responsible for any financial loss that may occur from investing in or trading. Please do your research before making any financial decisions.




