
 streamoors
 IGNITION
 NEAR Protocol
 Injective
 Pearl
Pearl LayerZero
 Quantus

Key Insights:
- Ethereum price hit $2,448 before cooling to $2,309, fueled by whale buys and Bitcoin’s rally.
- ETH broke out of a Head & Shoulders pattern with $2,700 now in sight if $2,500 resistance cracks.
- Lower L2 fees and Trump-linked whale buys are boosting market confidence and adoption.
Ethereum price skyrocketed 16.2% in the last 24 hours to hit an intra-day high of $2,448 after Bitcoin surged to $104,000. The price of ETH is hovering at $2,336 on a 5.9% drop in trading volume. Can ETH keep the vibes high and hit $2,700?
Ethereum Price Enjoys Wild Week: What’s Driving the Pump?
This week has been a rollercoaster for Ethereum, and the bulls are clearly in the driver’s seat. One major catalyst? Institutional money is pouring in heavily. According to a post from Lookonchain on X, a whale wallet related to Trump’s World Liberty Finance just scooped up 1,587 ETH worth $3.5 million, adding to their already hefty stack of ETH. That’s some big “I’m not selling” energy right there, signaling confidence in ETH’s future.
Ethereum’s Layer 2 solutions are also scaling like crazy. Transaction fees on L2s like Arbitrum and Optimism have dropped to pennies per L2Fees, making DeFi and NFT projects more accessible to the average user. Lower fees mean more adoption, which means more demand for ETH to pay for gas on the mainnet.
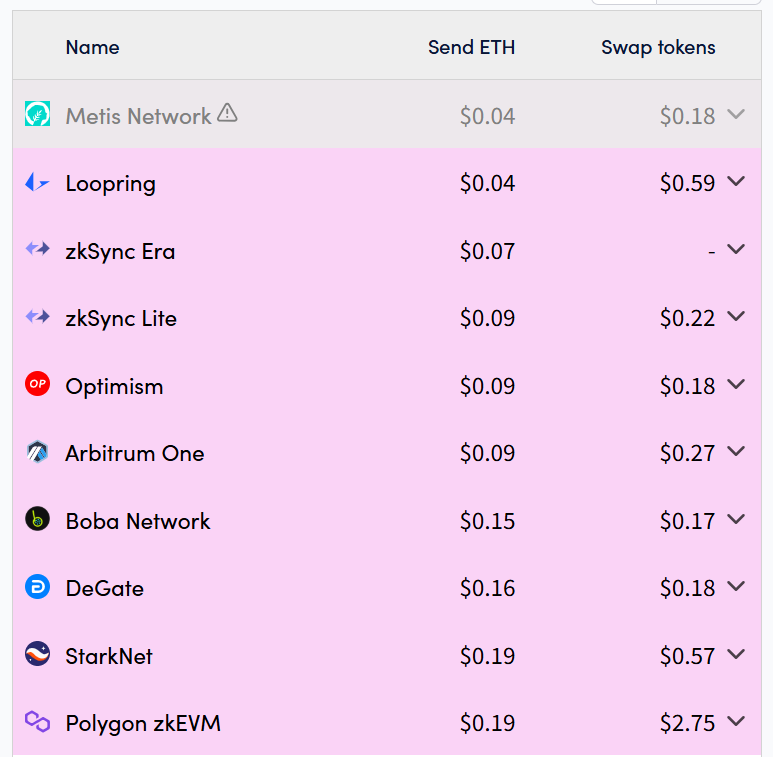
The SEC has been sniffing around Ethereum’s ETF staking, and while no concrete action has been taken this week, the optimism around such talk could spur more speculative accumulation. But let’s be real—after how ETH poorly performed post-ETF launch, holders are not too excited. In any case, the price action shows the market isn’t sweating it too much.
Ethereum Price Sports Head and Shoulders Breakout
The daily chart of ETH/USD shows a textbook Head and Shoulders pattern that just broke out to the upside. For the uninitiated, a Head and Shoulders is a reversal pattern.
The chart highlights the Left, Head, and Right Shoulder, with the neckline around $1,787. ETH dipped to a low of $1,385 (the Head) before bouncing back and forming the Right Shoulder. The breakout above the neckline happened with some solid volume, a green flag for bulls.
The measured move from a Head and Shoulder breakout is calculated by taking the distance from the Head to the neckline and projecting it upward from the breakout point. Here, the Head is at $1,385, and the neckline is around $1,787, so that’s a $402 difference. Add that to the breakout level of $1,787, and you get a target of roughly $2,189, which the asset swiftly sliced through in the recent rally.
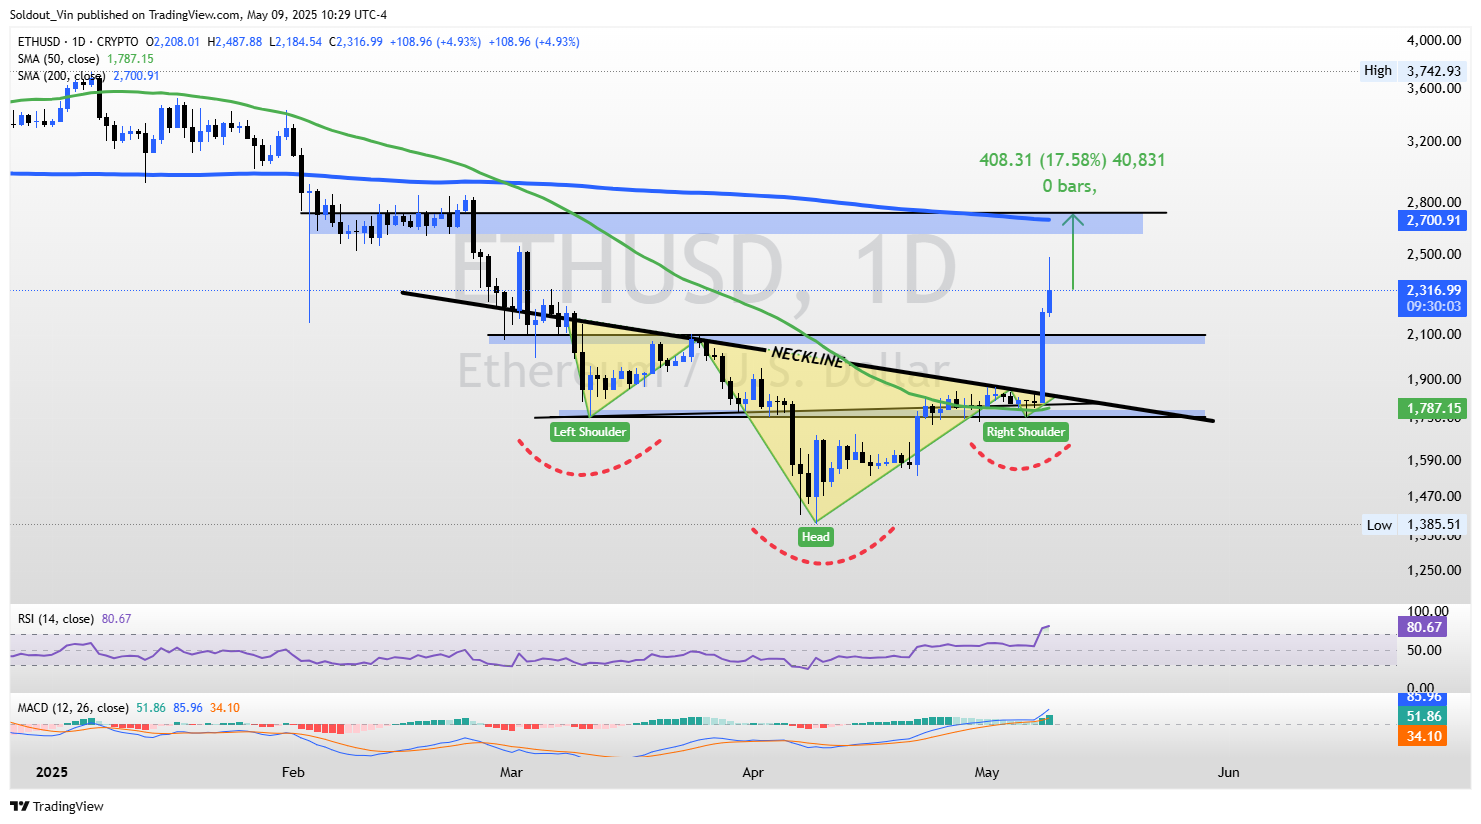
The chart shows a free ride to $2,700 as there is a minor resistance zone at $2,500. If it breaks this with conviction, the next stop is $2,700, a level that aligns with previous highs. But if the bears step in, we could see a pullback to the neckline at $2,100 for support.
The RSI (Relative Strength Index) is at 80, which is overbought territory. ETH might be due for a breather, but overbought conditions can persist in strong trends. The moving average convergence/divergence (MACD) indicator is also bullish, with the MACD line crossing above the signal line, showing momentum is still on the bulls’ side.
The 16.2% pump in 24 hours is no joke, and the breakout above the neckline on the chart confirms the bulls are in control. The whale accumulation and recent Pectra upgrade also fuel this rally, and the technicals are lining up for a push to $2,700. That $2,500 resistance is the next hurdle, and if ETH can smash through it, $2,700 is totally in play. However, the overbought RSI suggests a potential pullback, so don’t be shocked if we see a dip to $2,100 before the next leg up.
Disclaimer
This article is for informational purposes only and provides no financial, investment, or other advice. The author or any people mentioned in this article are not responsible for any financial loss that may occur from investing in or trading. Please do your research before making any financial decisions.




