
 no crying in the casino
 NEAR Protocol
 Starknet
 Pyth Network
 Pearl
Pearl Quantus
 Pudgy Penguins

Key Insights:
- Ripple (XRP) breaks the multi-year triangle pattern, signaling potential growth.
- Analyst links the current XRP cycle to 2017 historical price trends.
- Whale accumulation rises amid extended XRP market consolidation.
XRP has shown renewed momentum, with analysts and market data indicating the possibility of a significant price surge. Following Bitcoin’s recent recovery above $100,000, several altcoins, including Ripple, have joined the broader uptrend.
XRP, which recently touched the $3.3 mark, has since pulled back into a consolidation range around $2.41. Analysts predict this consolidation will lead to another upward movement.
Their outlook is based on historical chart patterns and large-scale investor accumulation. Technical signals and whale activity are drawing increased interest. This alignment suggests a potential breakout toward new cycle highs.
Symmetrical Triangle Breakout Signals Further Upside
Ali Martinez, a market analyst tracking long-term chart patterns, recently highlighted XRP’s breakout from a multi-year symmetrical triangle. This formation spanned from January 2018 to November 2024.
Ripple confirmed the breakout when it surged past $2 shortly after the U.S. elections in late 2024. According to Martinez, the asset is now consolidating above the breakout zone, potentially building momentum for the next phase.
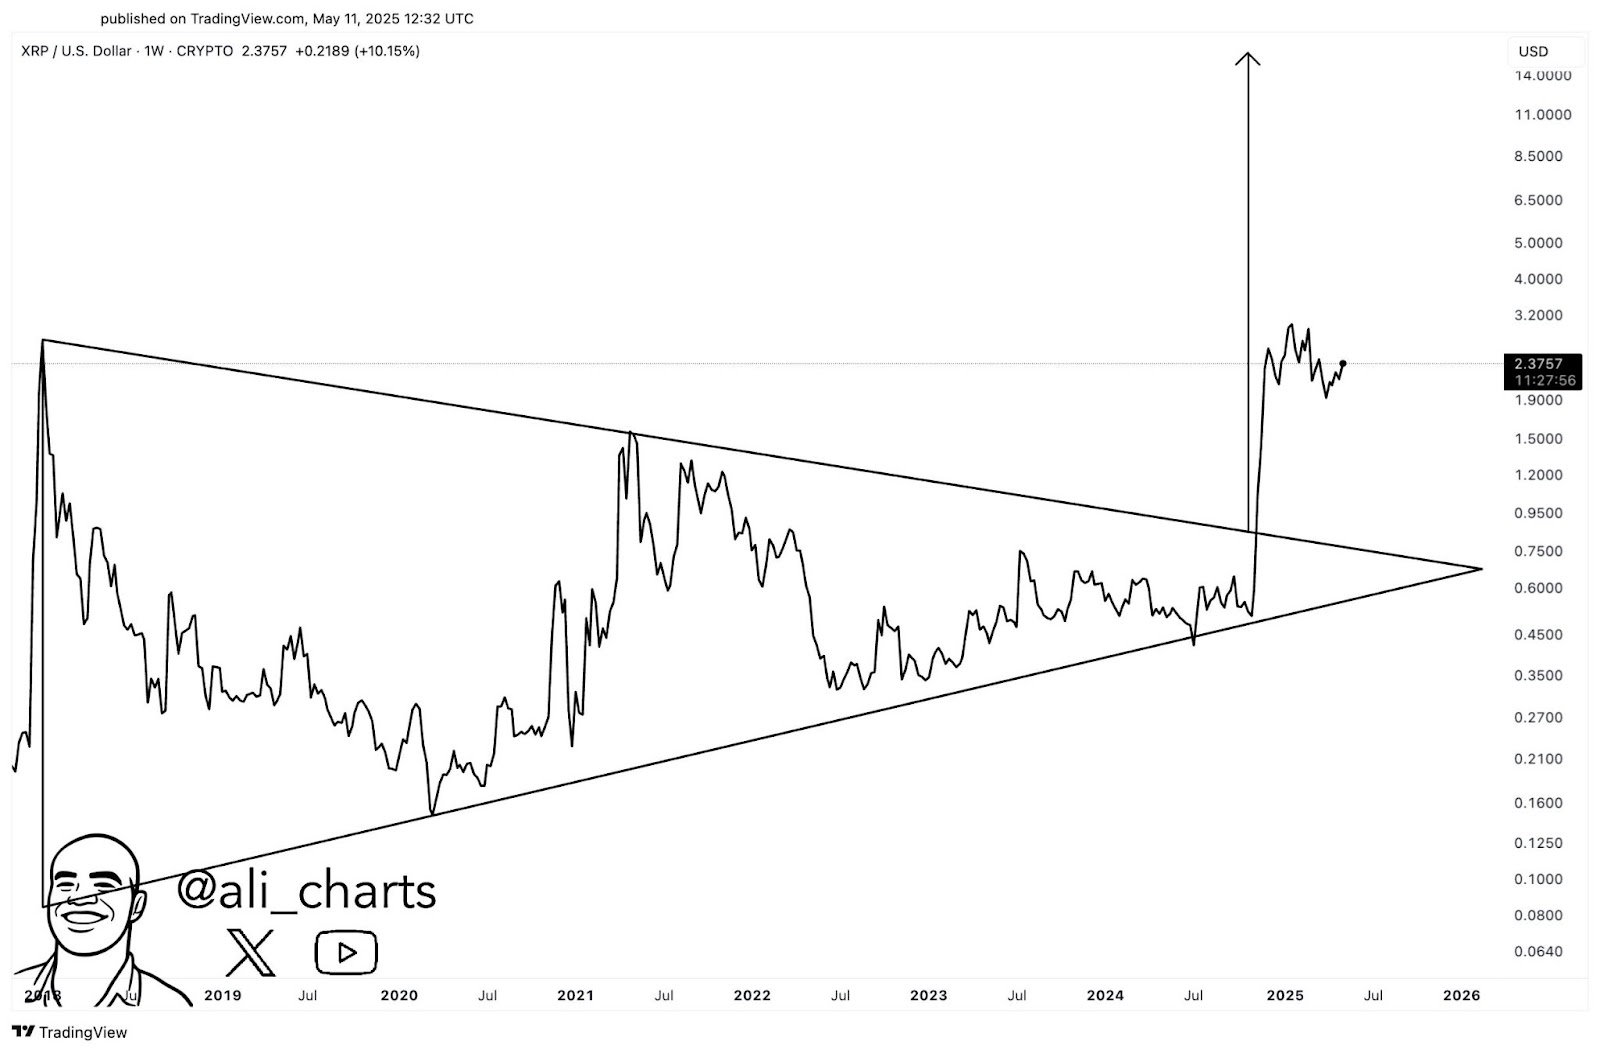
Martinez believes the symmetrical triangle still influences XRP price behavior. Based on this structure, he projects that the asset could rally to $15. This would represent a 522% increase from current levels.
The asset has held above the breakout threshold since January 2025, suggesting the pattern remains valid. The timing of this projection follows a market-wide resurgence, with Bitcoin’s climb providing tailwinds for assets like Ripple.
Historical Patterns Point to Blow-Off Top Potential
In a separate analysis, market analyst Mags connected Ripple’s current cycle to its 2017–2018 price structure. He previously identified the potential for a rally when Ripple traded below $0.50.
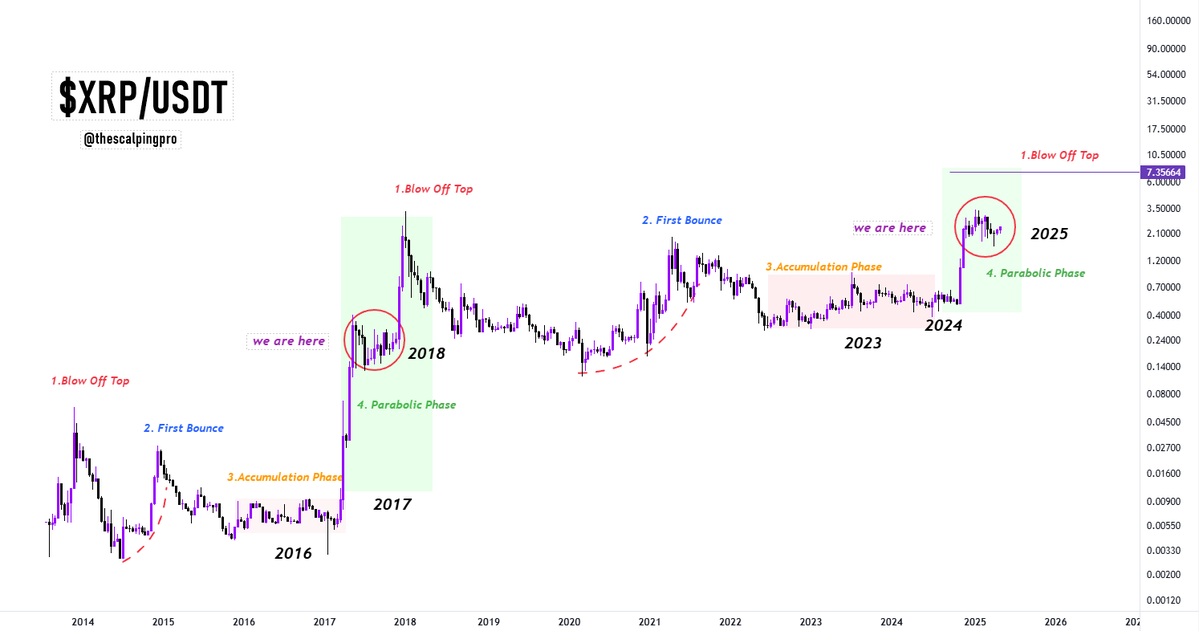
That forecast materialized, with the asset jumping nearly 600% from November 2024 to January 2025, peaking at $3.3. Since then, Ripple has entered a multi-month consolidation near the $2 mark, lasting from February through early May.
Mags noted similarities between the ongoing consolidation and a six-month range XRP maintained in 2017 before its final surge. Ripple climbed from $0.0055 in early 2017 to $3.4 in early 2018. He believes the market is approaching the blow-off top phase of its current cycle.
Mags outlined a four-phase model—first bounce, accumulation, parabolic run, and blow-off top—which XRP appears to be following again. According to his projection, the blow-off top in this cycle could push XRP to $7.3, marking a 202% increase from its present value.
Whale Accumulation and Leveraged Positions
Meanwhile, on-chain data has captured increasing activity from high-value investors. Between early April and May 8, wallets holding 10 million and 100 million XRP acquired over 880 million XRP.
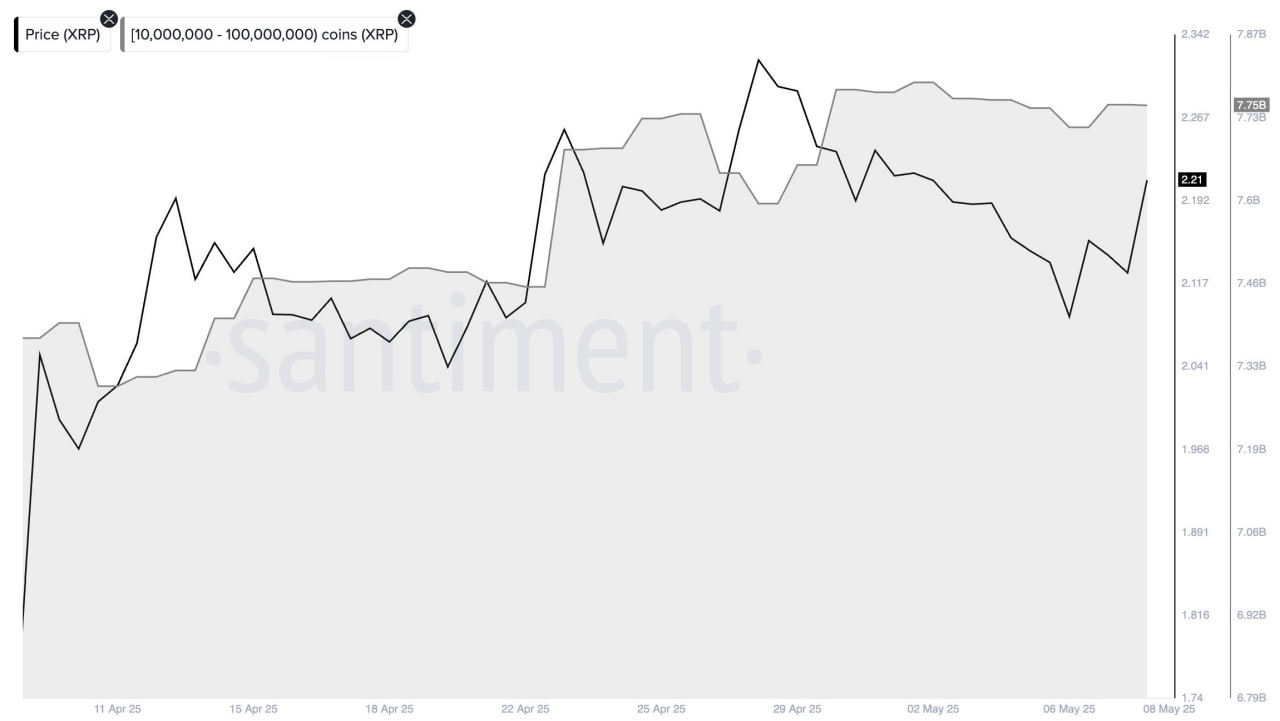
Their share totals grew from 6.9 billion to approximately 7.7 billion XRP during this period. During this time, the XRP price was consistent at $2.41. This led to the conclusion that positions were taken when price movements were mild.
Along with wallet activity, leveraged trades are giving out more positive signals. Information from Lookonchain tells us that a major investor recently took a long position in XRP worth $12 Million.
This action came on the heels of meaningful profits from Ethereum before the May rally. The amount of unrealized gains increased past $260,000 within just a few days. This trade was opened with XRP trading in a stable range, reinforcing continued institutional interest in quieter market periods.
The breakout from long-term patterns, historical cycle structures, and increased whale participation indicates a coordinated setup. If XRP holds above $2, analysts and fund movements indicate continued upward momentum. This trend could persist over the next few weeks.
Disclaimer
This article is for informational purposes only and provides no financial, investment, or other advice. The author or any people mentioned in this article are not responsible for any financial loss that may occur from investing in or trading. Please do your research before making any financial decisions.




