
 streamoors
 IGNITION
 Sui
Sui Quantus
 Bitcoin
 Pearl
Pearl Solana

Key Insights:
- XLM must hold $0.27 support or risk a 14% drop toward $0.23 based on key Fibonacci levels.
- Trading volume surged 84.78% to $232.37M, while Open Interest fell 3.61%, signaling cautious trader behavior.
- Long/short ratios above 1.6 on Binance and OKX show bullish bias, despite $553K in long liquidations in 24 hours.
Stellar Lumens (XLM) is at a critical point as it tests key support at $0.27. A breakdown could lead to a 14% drop toward $0.23. However, if the level holds, XLM could rally over 20% toward $0.34.
Current XLM Price Structure Shows Caution in the Market
XLM is trading at around $0.2825 after facing resistance near $0.33. The price is testing the midline of an ascending channel on the 4-hour chart. This area has acted as support in past sessions and may decide the next move. The structure signals a short-term correction after a rally in late April and early May.
Fibonacci retracement levels suggest that support lies at $0.2733, just below the current price. If the price falls below $0.27, it could head toward $0.23, near the 0.236 level of $0.2237. This range has seen strong buying interest before but may not hold if momentum weakens.
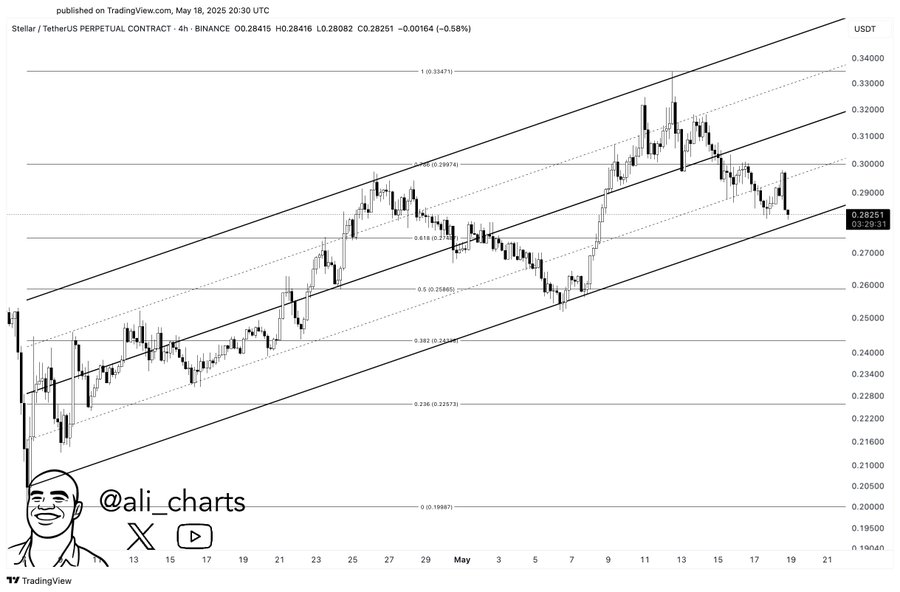
A move above $0.30 may renew bullish interest According To Ali Chart post on X. Breaking this level could open the door to $0.33 or $0.34, where resistance was seen recently. Meanwhile, support at $0.2586 and $0.2438 may come into play if sellers push the price lower.
Derivatives Metrics Indicate Bullish Sentiment With Caution
Data from derivatives markets shows rising interest in XLM but also signs of caution. Trading volume jumped 84.78% to $232.37 million, showing increased activity. However, Open Interest dropped by 3.61% to $149.21 million, suggesting some traders are closing positions.
The long/short ratio remains bullish across platforms. On Binance, the ratio is 1.8297, while OKX reports 1.6. These figures indicate more traders are holding long positions. Top trader metrics on Binance also lean bullish, with account and position ratios above 1.0.
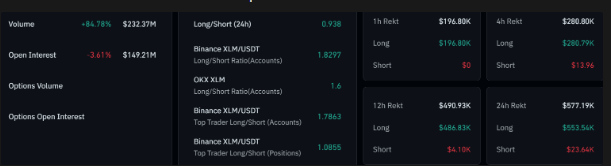
Liquidations in the past 24 hours totaled $577.19K. Of this, $553.54K were from long positions, while short liquidations made up just $23.64K. This points to volatility affecting buyers more than sellers, even though sentiment remains tilted toward further gains.
Historical Patterns Suggest Cyclical Behavior
XLM’s monthly chart shows repeated cycles of rallies and corrections since 2014. Notable spikes occurred in early 2018, early 2021, and late 2024. Each rally was followed by a sharp drop and long periods of sideways trading.
In 2018, the price peaked near $0.90. Later highs in 2021 and 2024 reached around $0.70 and $0.60. The current price near $0.280 follows a decline after the 2024 peak. This reflects a recurring pattern where rallies fade and the price consolidates before moving again.
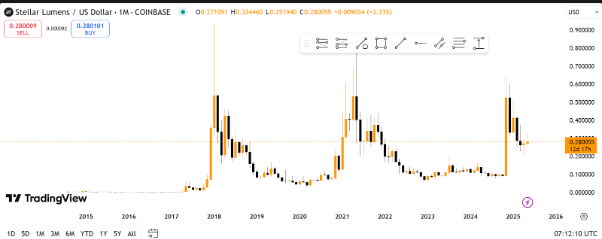
Right now, the price is holding within a $0.25 to $0.30 range. This may signal base formation, but a break in either direction could define the next trend. If pressure builds, a drop below $0.20 remains possible, though a breakout toward $0.34 could also occur if demand rises.
Volatility Slows but Liquidation Risk Remains
XLM liquidations surged to $12 million in Nov. 2024 as price spiked to $0.60. Since Feb., volatility has declined as leverage dropped.
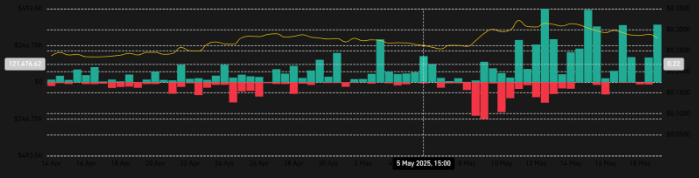
Still, the $577K in long liquidations over 24 hours highlights continued risk. If XLM breaks $0.27, liquidations could rise and send the price to $0.23 or lower.
If support holds and volume rises, XLM may climb toward $0.34. The coming sessions will be critical in deciding short-term direction.
Disclaimer
In this article, the views and opinions stated by the author or any people named are for informational purposes only. And they don’t establish the investment, financial, or any other advice. Trading or investing in cryptocurrency assets comes with a risk of financial loss.




