
 streamoors
 IGNITION
 Injective
 Aerodrome Finance
 ZKsync
 Collector Crypt
 Sui
Sui

Key Insights:
- Binance sees strong altcoin outflows, signaling rising holder confidence.
- However, Wikipedia crypto searches stay low despite Bitcoin nearing ATH.
- ETF flows show bullish signs as prices hold despite large outflows.
Despite improving on-chain metrics, retail attention toward cryptocurrencies remains limited. Binance data reveals strong altcoin withdrawals, while ETF flows show institutional interest. Still, Wikipedia search volumes suggest retail users are not fully engaged.
Altcoin Withdrawals from Binance Signal Growing Confidence
CryptoQuant’s Binance Netflow Heatmap reveals that altcoins have been withdrawn from BNB in greater numbers lately. The bottom section of the chart, shown by a white box, is for tokens whose users are withdrawing more than they are depositing.
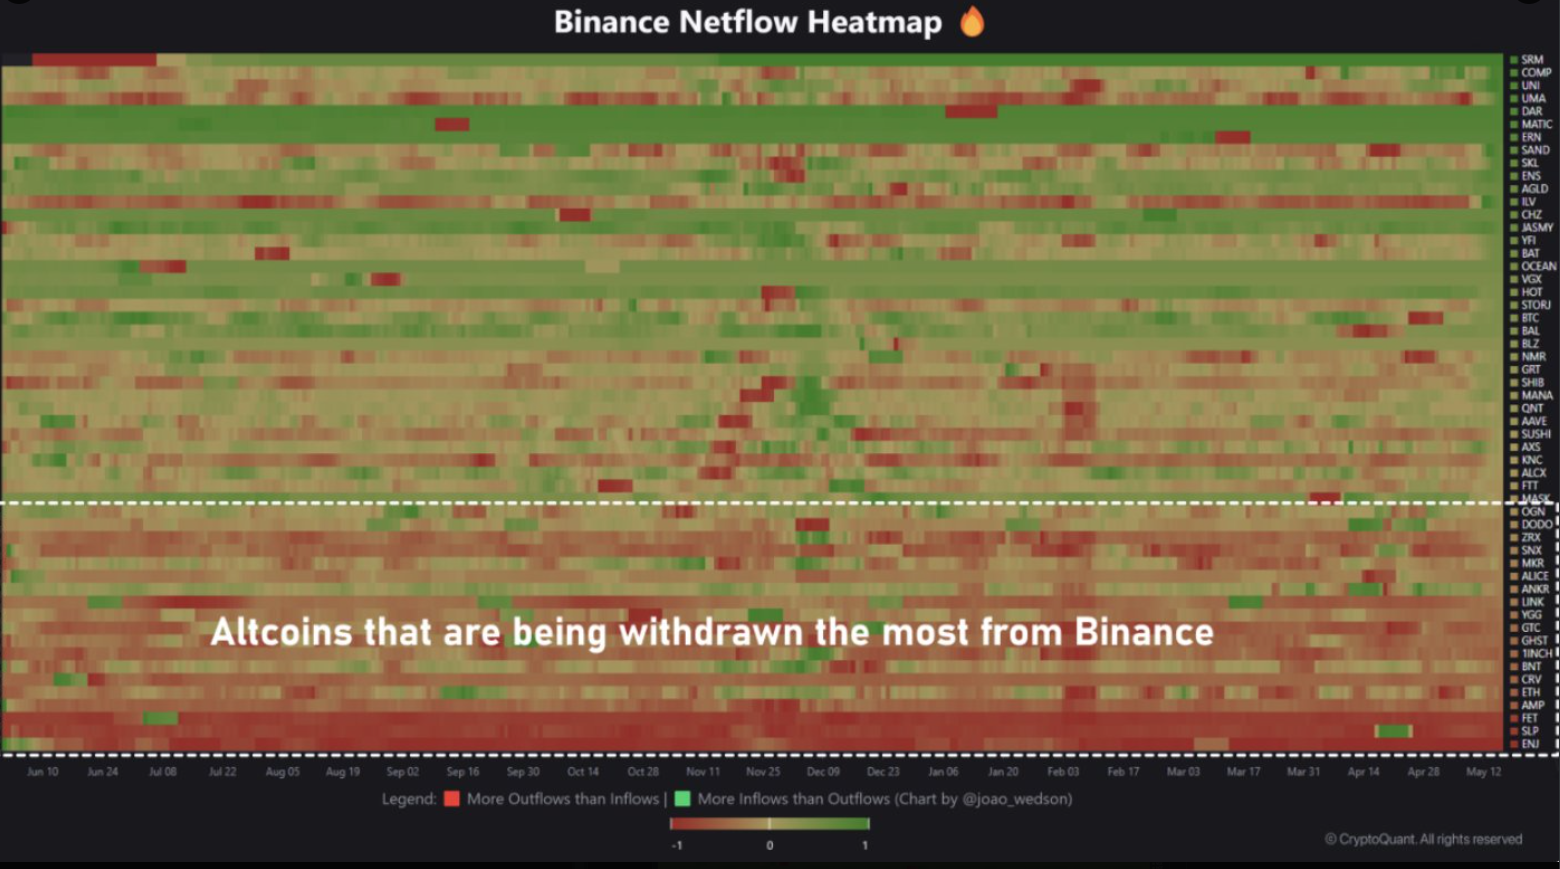
The red colors on SL, SLP, FET, AMP and ETH indicate that money is being taken out of these altcoins. The pattern began to show in early February 2025 and has become stronger by mid-May.
Joao Wedson commented, “It reflects that people are eager to remove these altcoins from the exchange which is a clear sign of accumulation.”
The chart also shows data for the periods June 2023 to May 2025. In the time that has passed, the trend in withdrawals has moved from mixed to mostly negative netflows, especially in the past 3 months.
It seems that users are gaining more confidence in keeping their altcoins on their own wallets which could signal a longer-term shift in the market.
Wikipedia Search Trends Show Decline in Retail Attention
Even though people are taking their altcoins off Binance, the public’s interest in cryptocurrencies has not increased. According to Alphractal’s report based on Wikipedia statistics, search interest is much lower now than during previous bull runs.
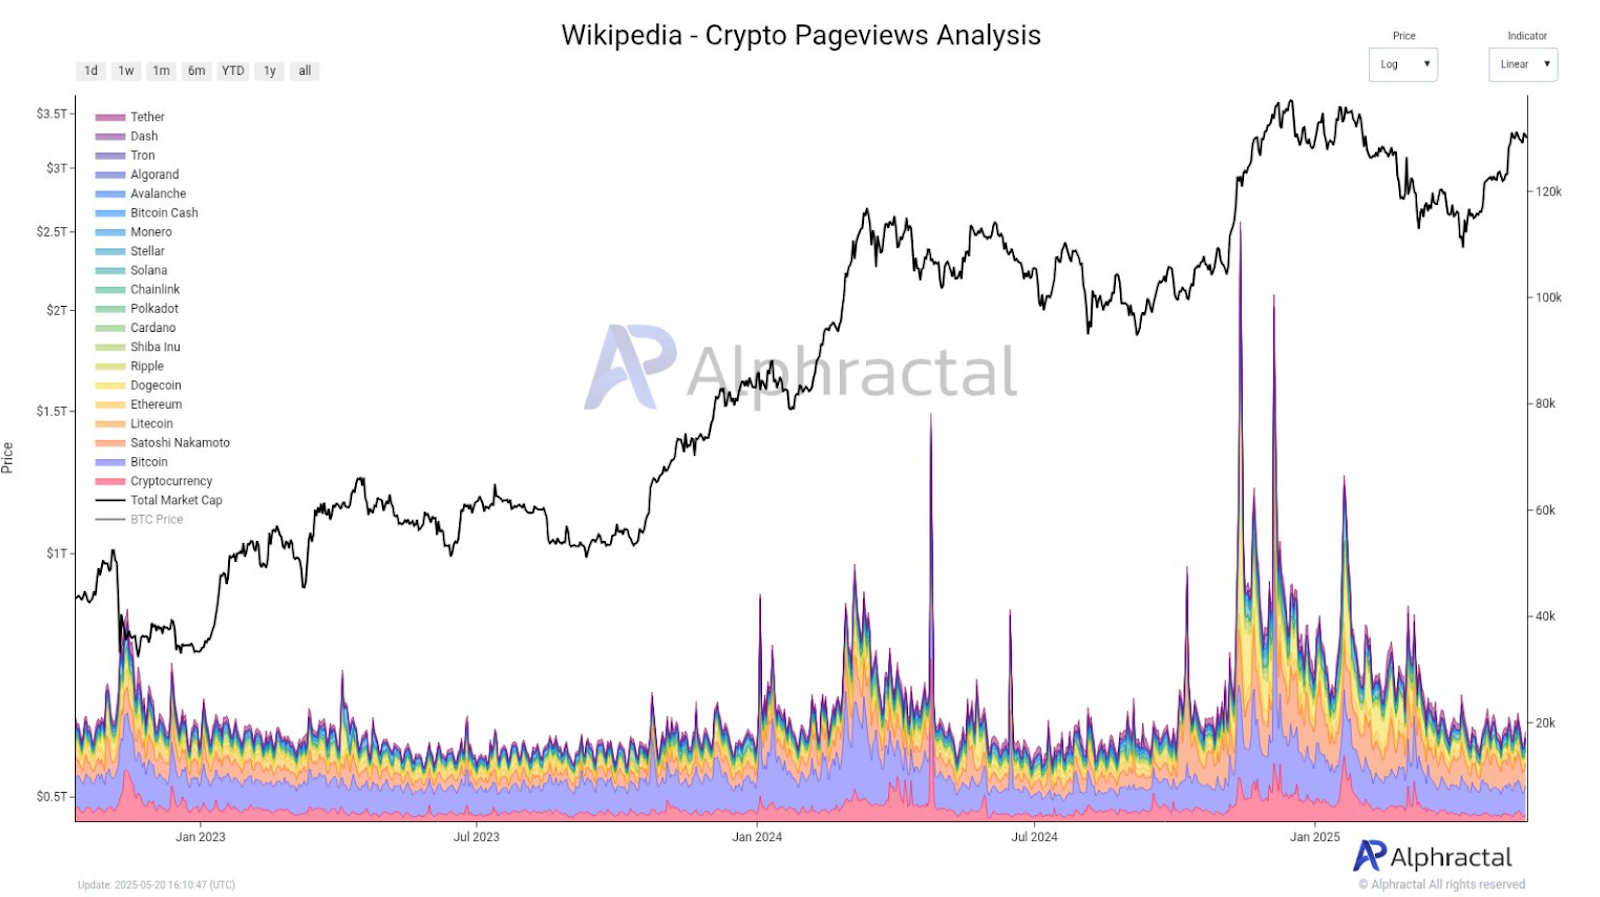
During late 2023 and early 2025, there were several periods when search volume increased. These peaks usually lined up with the highest prices reached by Bitcoin and other main cryptocurrencies.
For instance, a sharp rise in January 2024 happened before a quick Bitcoin correction. Afterwards, people’s interest decreased, even as Bitcoin got close to its highest price in early 2025.
Alphractal observed that retail interest is currently lower than before, which reflects a lack of confidence. It appears that the main reason for the market’s growth is due to institutional or experienced investors, not retail buyers.
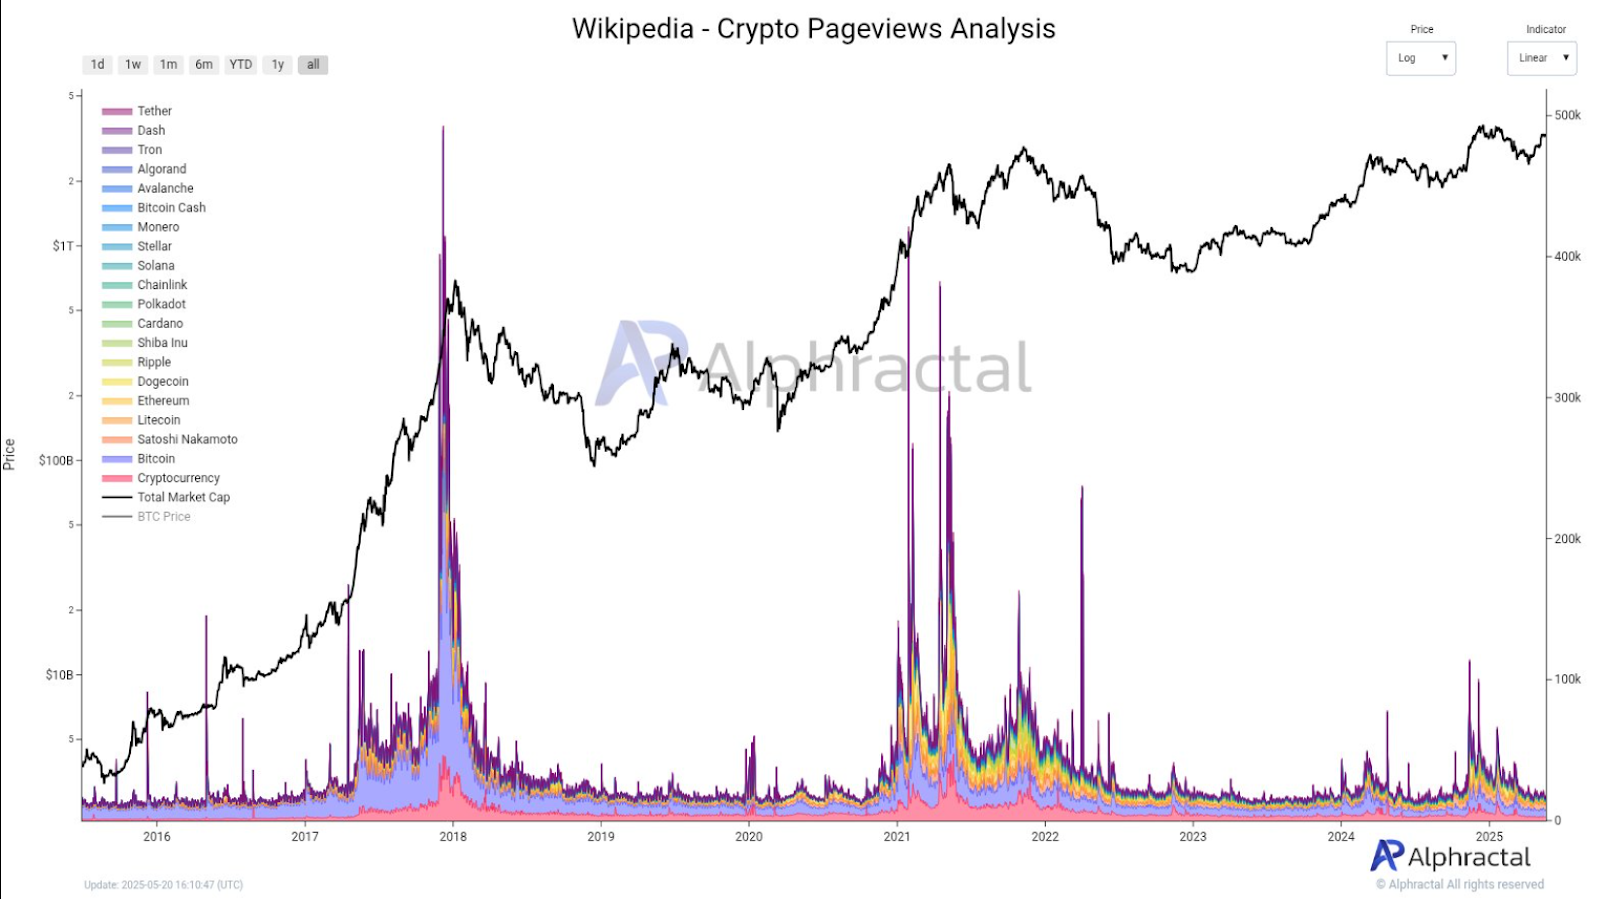
The data above covering the period since 2016 reveals some clear historical trends. We saw search numbers increase around the 2017 and 2021 bull runs.
Altcoin Market Cap Structure Mirrors 2017 Setup
Additionally, a comparison of the 2017 rally and today’s market conditions reveals a bottom pattern that is followed by a breakout.
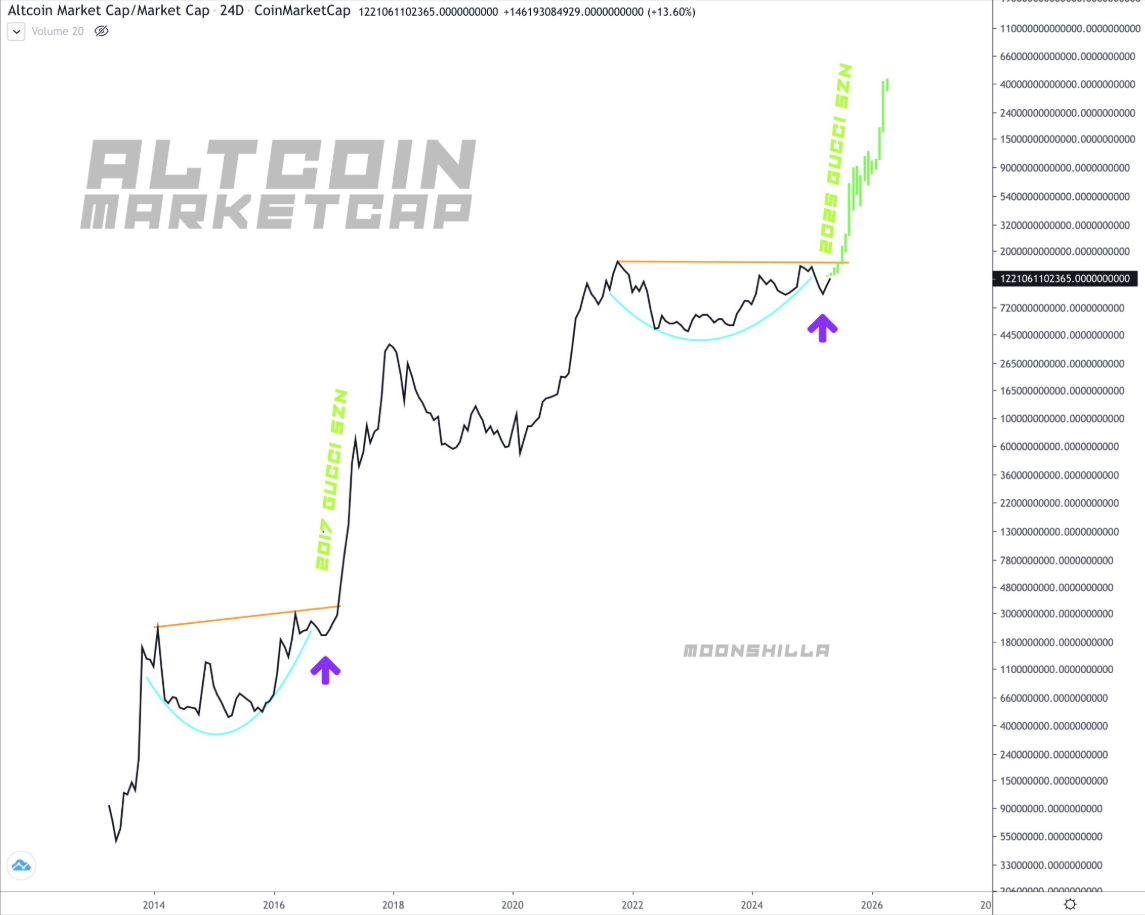
Back in 2017, the altcoin market cap pushed past its resistance and started to soar. In 2025, the chart is close to breaking through a resistance line it has been stuck against for years.
The market cap has now reached 1.22 trillion, and there is still space for more growth if things continue as they are. Based on past events, this structure is likely to repeat as long as the overall market remains positive.
ETF Flows Add to Market Signals
Furthermore, BGeometrics’ ETF data shows important trends in how investors act with Bitcoin. USD inflows are shown by green bars, and outflows are represented by red bars. The white line represents Bitcoin’s price.
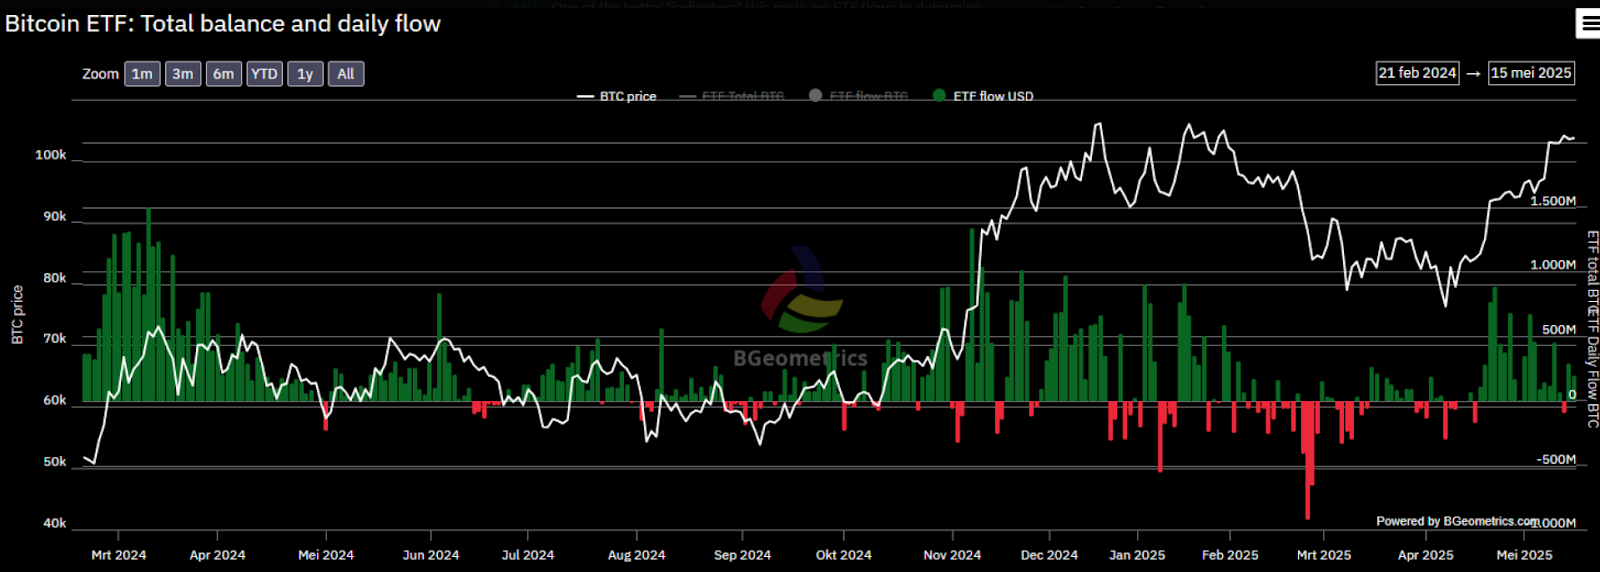
In Feb.–Mar. 2025, ETFs saw large outflows, yet Bitcoin barely dropped. Daan Crypto noted, “When outflows rise but price stays steady, that’s usually bullish.”
By May 2025, ETF inflows resumed, supporting Bitcoin’s climb toward its all-time high. The data suggests that large buyers continue absorbing supply.
Disclaimer
In this article, the views and opinions stated by the author or any people named are for informational purposes only, and they don’t establish the investment, financial, or any other advice. Trading or investing in cryptocurrency assets comes with a risk of financial loss.




