
 Zerebro
 Bitcoin
 Aerodrome Finance
 ZKsync
 Pearl
Pearl Pudgy Penguins
 Bitway

Key Insights:
- An inverse head and shoulders pattern signals that a breakout above $2,700 could push ETH to $3,000.
- Ethereum faces a key resistance at $2,700, which, if broken, confirms a bullish reversal structure.
- Ethereum is consolidating below $2,565 with downside risk toward the $2,380 support level.
Ethereum (ETH) price is trading within a critical zone, with analysts divided over whether it will break higher or revisit lower support levels. Price action showed signs of both a potential breakout and downside retest.
Ethereum Price $2,700 Breakout May Unlock $3,000 Target
Notably, the Ethereum price has formed a classic inverse head and shoulders pattern, typically associated with bullish trend reversals. Chart analysis from analyst TedPillows identified this formation, with the neckline positioned near the $2,700 level.
Additionally, the pattern included two shallow troughs on either side of a deeper central low, often signaling an upcoming upward breakout.
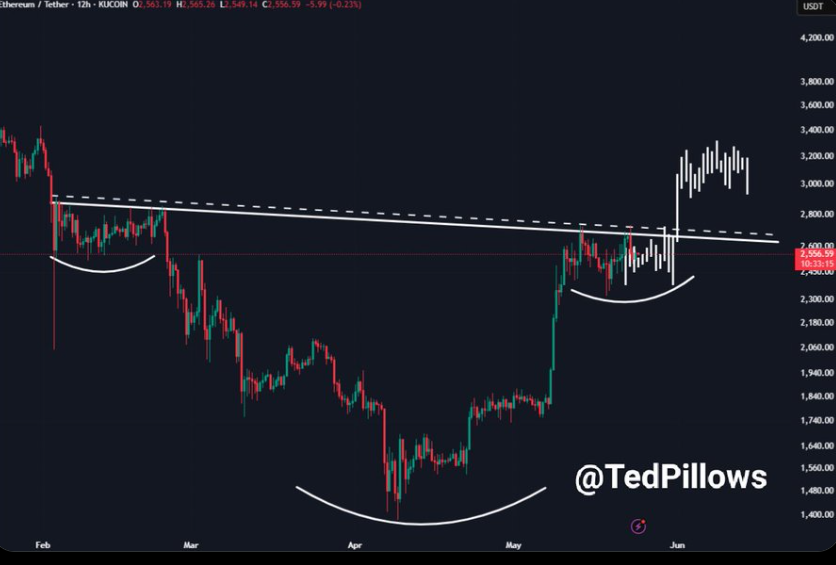
Consequently, a confirmed close above $2,700 could shift ETH momentum strongly to the upside. The projected move based on the height of the pattern suggested a short-term target around $3,000.
Historical data supported this ETH price prediction, as similar breakout setups have led to steep rallies in previous cycles. However, confirmation requires strong volume and price sustainability above this resistance zone.
Resistance at $2,700 Remains a Barrier
Despite the bullish setup, Ethereum has yet to clear the $2,700 resistance, which continues to cap upward movement. The price has tested this level multiple times in May without a decisive breakout. Bears have defended the zone, leading to short-term pullbacks and consolidation below the neckline.
In addition, this resistance trendline also coincided with a multi-month descending structure that dates back to early 2024. A rejection from this level without sufficient buyer pressure could invalidate the bullish pattern.
Until ETH records a clean break and retest of $2,700, some analysts remain cautious about declaring the beginning of a confirmed upward trend.
Supporting a bullish outlook, recent analysis showed Ethereum price trading near its 200-day SMA, a key technical level around $2,700. A breakout above this mark could push prices toward $3,500–$3,600. Rising open interest, strong CVD, and institutional accumulation, including BlackRock’s $24.9 million ETH purchase, further support the view that Ethereum’s trend remains upward.
Ethereum Price Consolidates Below $2,565 Mid-Range
While attention remained on the neckline breakout, Ethereum price is currently trading below $2,565. This level has acted as an intraday pivot zone on the 4-hour chart. Data from analyst Ali Martinez showed the price oscillating between short-term highs and lows within a horizontal range. This range is bounded between approximately $2,725 and $2,380.
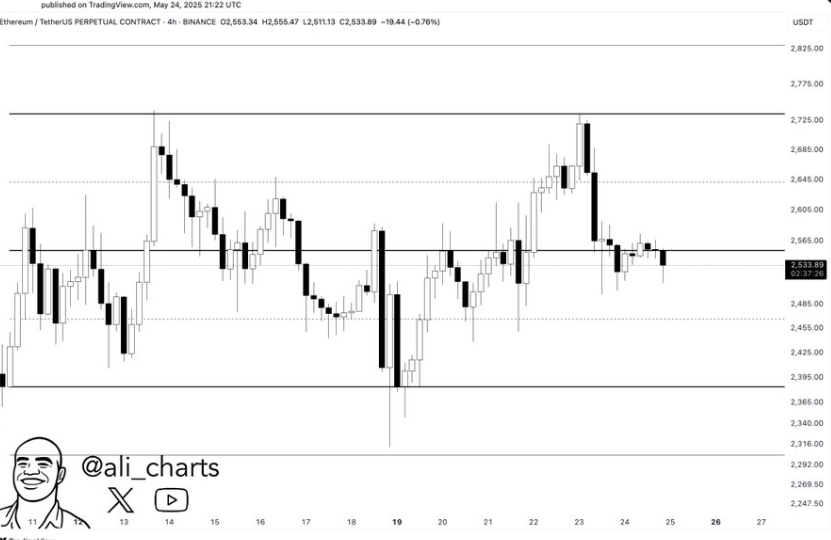
Sideways price movement reflects indecision in the market, with neither bulls nor bears fully in control. The pattern suggested that traders are awaiting a catalyst before committing to a directional move. If Ethereum price fails to reclaim $2,565 soon, short-term pressure may increase as traders eye lower levels for support.
$2,380 Support Level Remains in Play
In the event of further downside, the lower boundary of the current trading range near $2,380 is the next support level to monitor. This area has held firm during past retracements and marked a key zone of interest for buyers in April and early May. A move toward this level would negate the bullish breakout thesis and suggest short-term weakness in price action.
More so, the chart posted by Martinez indicated a potential retest of this support level if Ethereum price cannot regain strength above $2,565. The bearish scenario remains valid unless volume and momentum return to push the asset above the neckline.
Disclaimer
In this article, the views and opinions stated by the author or any people named are for informational purposes only, and they don’t establish the investment, financial, or any other advice. Trading or investing in cryptocurrency assets comes with a risk of financial loss.




