
 Sword Inu
 streamoors
 Altai the Tiger
 no crying in the casino
 IGNITION
 Pudgy Penguins
 Quantus

Key Insights:
- Long-term macro cycle analysis implies Dogecoin may repeat historical breakouts with projected targets between $3 and $12.
- Monthly chart patterns suggest Dogecoin is exiting its third major accumulation phase, mirroring past pre-rally setups.
- The TD Sequential indicator on the hourly chart has flashed a buy signal near $0.224, hinting at a possible short-term Dogecoin price rebound.
Interest in Dogecoin (DOGE) price increased as analysts highlighted familiar setups that historically preceded strong rallies. Across multiple timeframes, technical patterns suggested a potential breakout was forming.
Long-Term Cycles Suggest Multi-Dollar Dogecoin Price Targets
Since 2015, Dogecoin price repeatedly followed a three-step macro cycle. Each cycle began with prolonged accumulation, followed by gradual increases and sudden spikes.
Trade Tardigrade posted a logarithmic chart indicating that Dogecoin had completed a third long-term consolidation. According to historical patterns, this may signal an incoming surge.
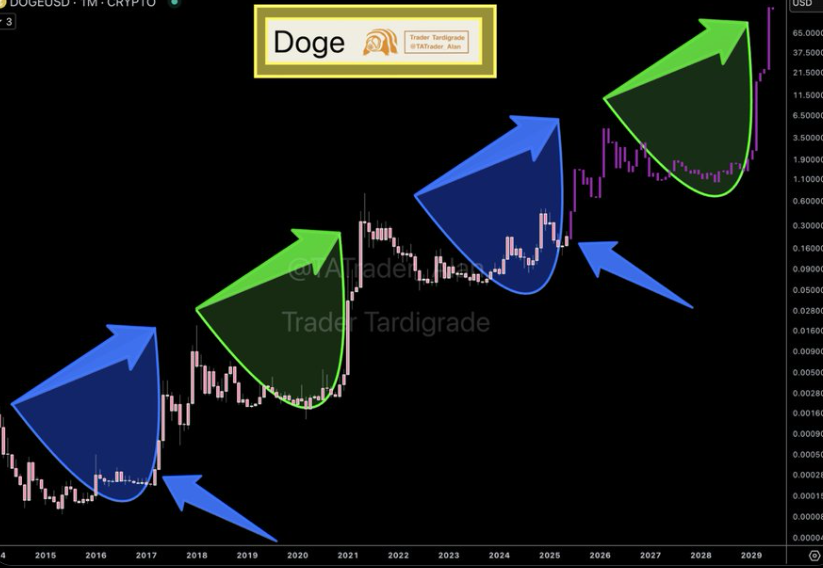
Notably, the long-term chart highlighted two breakouts from 2017 and 2021, where the rise was built on a rounded-bottom pattern. Based on the current monthly setup, this cycle has appeared again, possibly indicating that another bullish phase might start.
By following past trends, the upside price targets for DOGE could be between $3 and $12. These are not guaranteed outcomes, but they are derived from repeatable structures seen in past performance.
Monthly Accumulation Pattern Aligns With Historical Structure
More so, a chart shared by analyst @KamranAsghar revealed a rounded-bottom pattern seen in the monthly chart, supporting the macro thesis. The pattern repeated the shapes seen during previous Dogecoin rallies.
Additionally, this pattern showed a switch from falling prices to a buildup zone that often leads to bullish markets.
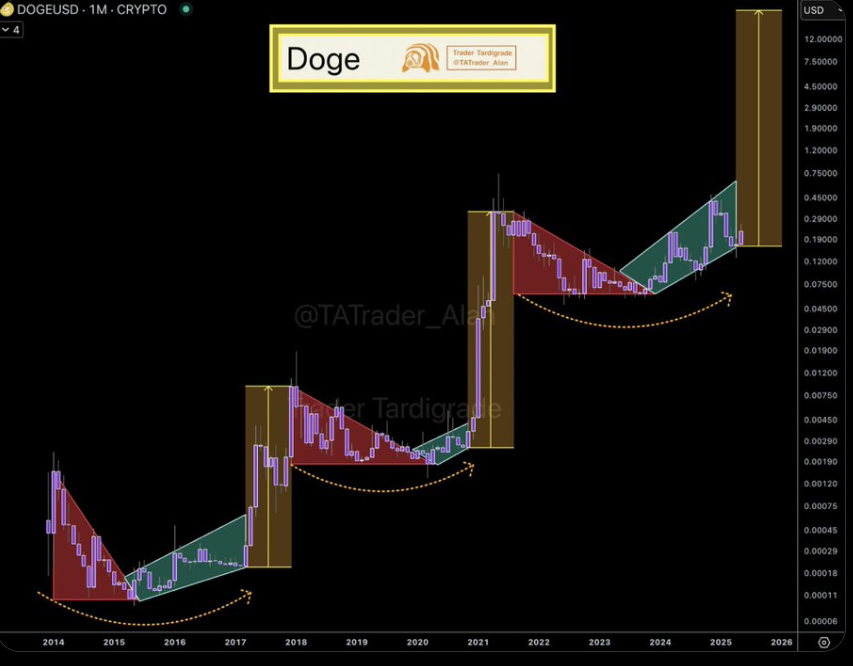
Dogecoin price has slowly bounced back from its lowest point, forming new higher lows frequently. @KamranAsgha remarked that a bottomed-out look on the chart, along with increasing volume, usually signals an upcoming sharp rise in price. Even with the changing market, seeing similarities to earlier cycles supports the prediction of Dogecoin breaking out.
Short-Term Chart Shows Rebound Potential
On the shorter-term charts, Dogecoin price showed bullish signals matching the longer-term trend. According to analyst Ali Martinez, a TD Sequential indicator on the 1-hour chart now has nine candles in a row.
Additionally, it is followed by a green “1” candle near the $0.224 price level. Usually, this structure suggests a brief change in direction, especially after price dips.
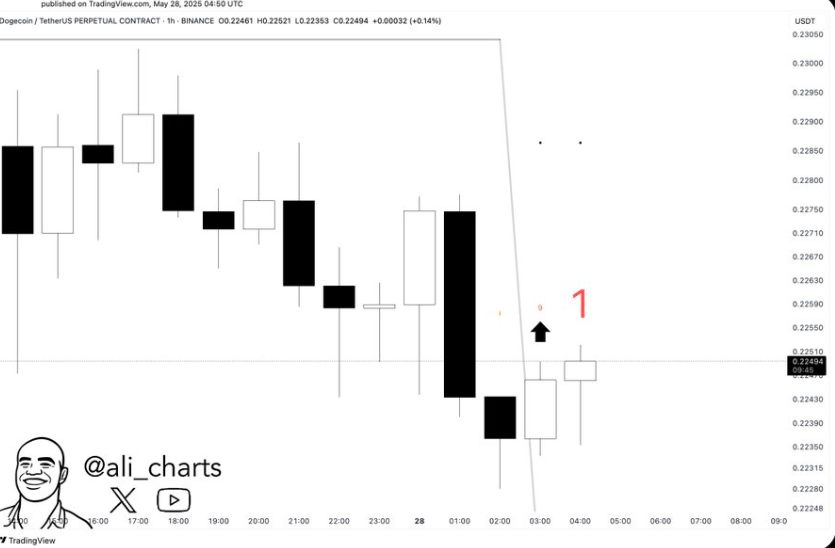
The setup occurred as DOGE price hovered above short-term support. The combination of a completed count and a bullish engulfing candle added weight to the case for a rebound.
If price breaks above $0.224, it may retest $0.229 resistance. However, if support fails, the bounce could fade quickly, bringing back downward pressure.
Adding to the bullish case, recent analysis showed Dogecoin breaking out from a bull flag formation. This pattern historically led to sharp moves higher. DOGE faced resistance at $0.2465, but rising RSI, On-Balance Volume, and steady funding rates pointed to renewed buying strength.
If volume continues to rise, price targets between $0.29 and $0.95 may become achievable. The Fear & Greed Index at 78 indicated elevated confidence among market participants.
Dogecoin Price Technical Structure Mirrors 2017 and 2021
From a broader perspective, DOGE’s current structure aligned with cycles seen in 2017 and 2021. Those rallies began with long accumulation phases before launching into rapid gains. Analysts using fractals and logarithmic projections noted that current price action mirrored those earlier trends.
DOGE found consistent support between $0.22 and $0.23 during recent dips. Should that zone hold and volume rise, analysts believe price could reach $0.30 and, over time, aim for $3. While no breakout has been confirmed, the structure and momentum resembled conditions that preceded past exponential moves.
Disclaimer
This article is for informational purposes only and provides no financial, investment, or other advice. The author or any people mentioned in this article are not responsible for any financial loss that may occur from investing in or trading. Please do your research before making any financial decisions.




