
 Sword Inu
 streamoors
 Altai the Tiger
 no crying in the casino
 IGNITION
 Pudgy Penguins
 Quantus

Key Insights:
- Polkadot (DOT) broke its long-term downtrend with strong bullish momentum supported by a key $3.7 support level.
- Major resistance levels to watch are $10, $23.20, and $42.30, signaling potential large price gains if these are surpassed.
- Market data shows steady trading volume and market cap around $7.21 billion, reinforcing confidence in DOT’s price growth outlook.
DOT broke through its previous downward trend, suggesting the bulls are back. Some people in the crypto market remain skeptical, but the data shows that DOT is likely to see a big rally thanks to important price points and how the market is acting.
Polkadot, which recently broke out of a downtrend, weekly data shows the key price surge above a long-standing downward line that had slowed the price change. The rise in volume, with 5.39 million trades last week, is a key part of this breakout.
When the breakout area was recognized in mid-2023, the increase in price bust the downtrend and indicated the trend was ending.
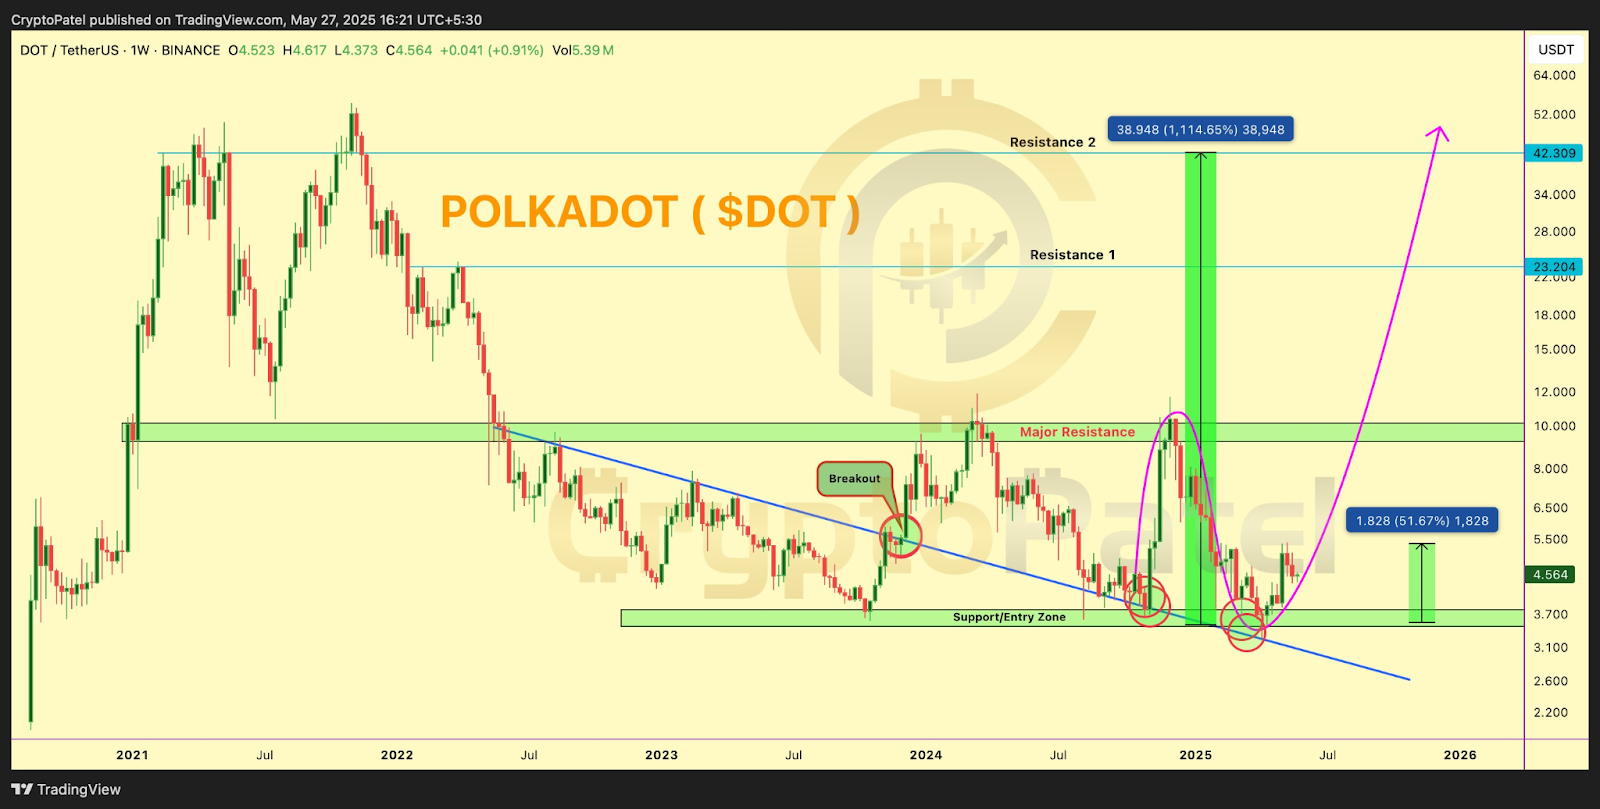
Since the price moved above $3.7, the market has been supporting bulls. The highlighted area on the weekly chart became an important buying level that maintained prices heading up.
There are multiple instances in which price was rejected at this support, so sellers could not decrease it, resulting in extra support for this part of the chart.
Major Resistance and Support Levels
The chart marks out two important resistance areas, at $10 and $23.20. The $10 level reflects an area from the past where price met with tough resistance and moved down, turning it into major resistance for the bulls now. If Polkadot maintains its upward trend, a second resistance levels at $23.20 and an additional aim near $42.30 can be envisioned.
However, the $3.7 level is incredibly important as it anchors the present structure of prices. We’ve often observed that as prices reach this zone, buyers use it as a gateway to make strong bouncebacks.
Polkadot was priced at $4.46 while writing, well above its important support which gives it some additional upward room. Its total market capitalization was about $7.07 billion, and average trading volume in the last 24 hours is about $213.02 million. The market is seeing consistent levels of investment and trading at the same price points.
A falling wedge which is considered bullish, has just been confirmed on the 4-hour daily chart due to recent support from price consolidation and increasing strength.
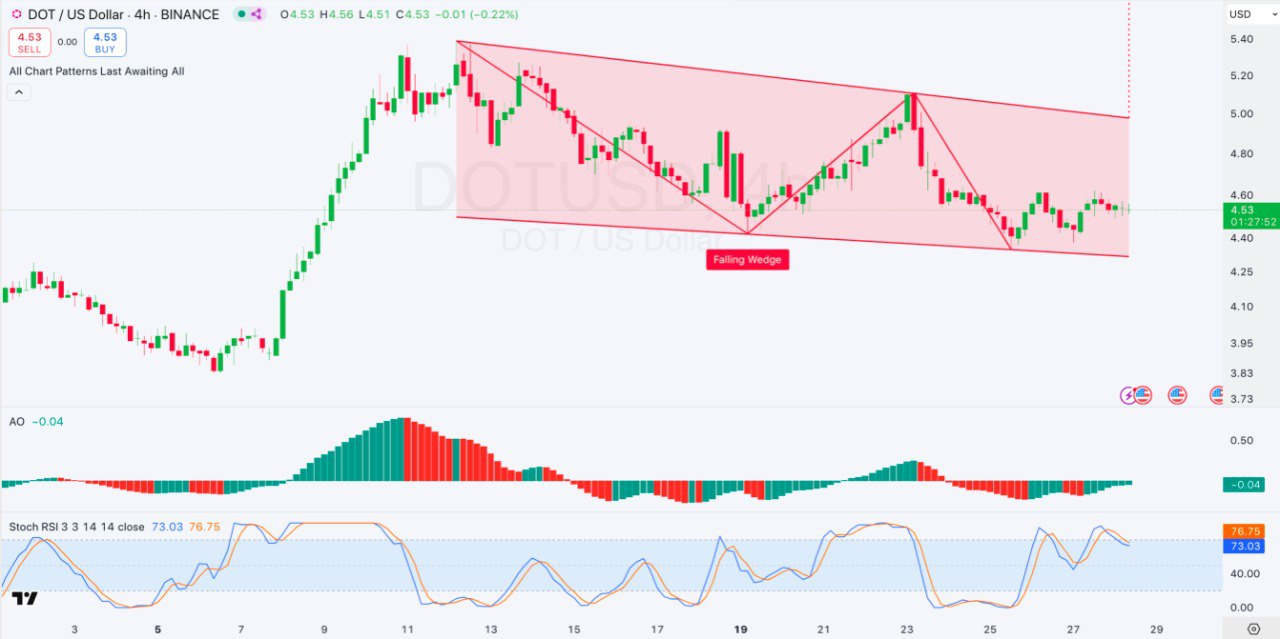
Red bars in the Awesome Oscillator (AO) lead to green ones, demonstrating rising bullish pressure, and the Stochastic. RSI moving close to the overbought region reflects strong interest by buyers. This comes just a week after the token had formed a bullish wedge on the daily charts.
Polkadot Price Prediction and Market Outlook
Analysts see a solid setup for an upward trend following the breakout and strong solid support right at $3.7. If DOT rises above $10, it could add more than 100% to its cost today.
If this level is crossed, Polkadot could pursue resistance at $23.20 or even the $42.30 price point. According to the weekly chart analysis that indicates an over 1100% bullish move.
Support keeps holding the market up and the recent bullish reversal signal shows that the trend may continue to rise. The breakout area found in mid-2023 highlights a major change in how the market works. Which indicates Polkadot has reached a new stage of development.
Even after some investors sold their positions because of declines, the technical signs still show that Polkadot’s market is strong.
All in all, the strong technical trends Polkadot has shown hint at an important rally getting started. Support for the crypto remains at $3.7 and a step above its downtrend confirms it is finding buyers.
Disclaimer
This article is for informational purposes only and provides no financial, investment, or other advice. The author or any people mentioned in this article are not responsible for any financial loss. That may occur from investing in or trading. Please do your research before making any financial decisions.




