
 Altai the Tiger
 Sword Inu
 streamoors
 IGNITION
 NEAR Protocol
 Pearl
Pearl Injective

Key Highlights
- Bitcoin sees 3.6K more coins withdrawn daily from exchanges than deposited, signaling buying pressure.
- Institutions bought 417K BTC YTD in 2025, while individuals sold 158K BTC, per Bitwise.
- Over 1,455 wallets now hold 1,000+ BTC, marking a return of whale accumulation.
Bitcoin exchange netflows have turned negative, with 3,600 BTC withdrawn daily since March 10, 2025. This consistent outflow suggests increased accumulation, particularly by institutional players and large wallets.
BTC traded around $105,000, showing strong bullish momentum in market data. However, short-term price movements remain relatively subdued.
Bitcoin Netflows Reverse as Demand Accelerates
Since March 10, 2025, exchange netflows for Bitcoin have moved into consistent negative territory. On average, 3,600 BTC are withdrawn daily from exchanges.
This shows a growing preference for long-term holding. These conditions shift from 2022’s peak netflow of +12.1K BTC to today’s accumulation trend.
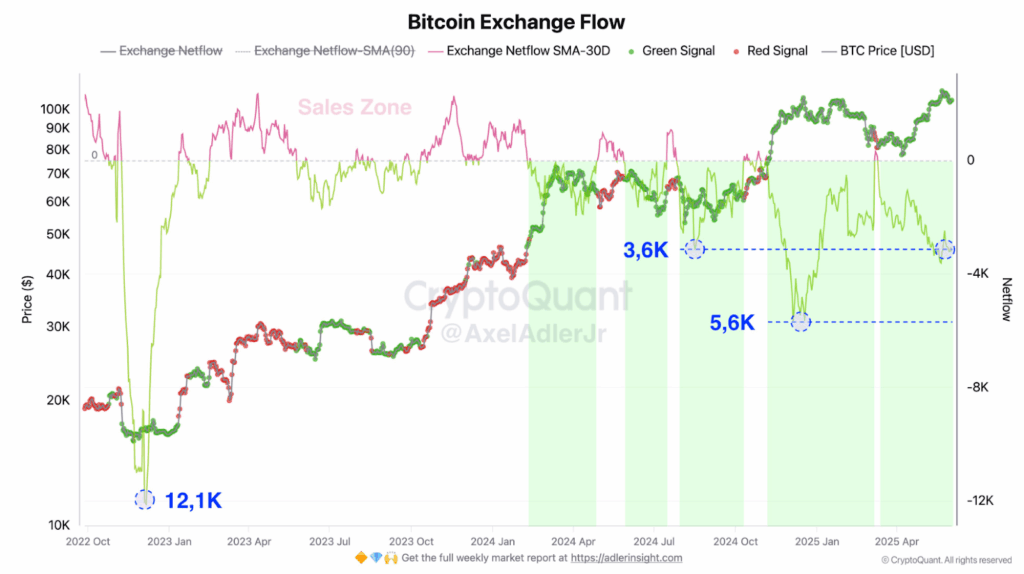
This reversal indicates buying pressure, especially as supply leaves centralised platforms. Retail investors are withdrawing funds while institutional entities are reducing the liquid supply.
The green zones on the exchange flow chart reflect these accumulation phases tied to net outflow spikes.
Netflows reached prior negative lows of 5.6K and 3.6K in previous bull runs, supporting historical trends. Such patterns have previously preceded major upside moves in Bitcoin price performance.
Institutional Inflows Dominate 2025 Bitcoin Demand
Bitwise data confirms institutional investors remain the strongest source of demand for Bitcoin in 2025. Public companies, funds & ETPs added 417,000 BTC year-to-date, driving most of the positive demand.
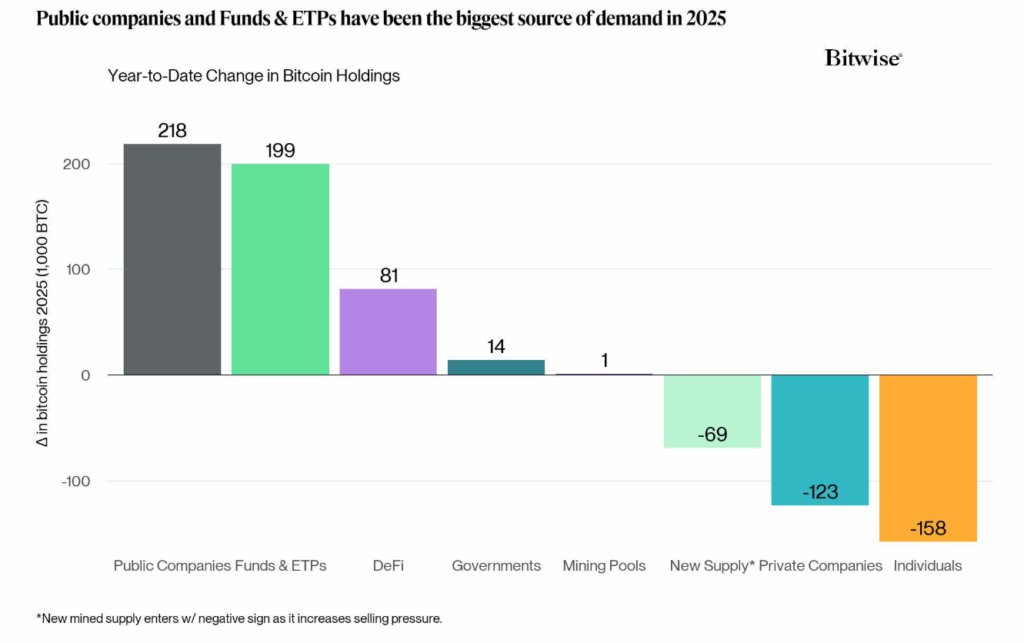
This contrasts sharply with individual investors, who sold 158,000 BTC over the same period. Private companies also reduced exposure by 123,000 BTC, showing risk-off behavior among smaller firms.
Meanwhile, DeFi wallets added 81,000 BTC, followed by governments and mining pools with minor net gains. New Bitcoin supply entered the market at 69,000 BTC, adding modest selling pressure.
Institutional buying continues despite Bitcoin’s recent price plateau around $105,000. Funds have increased their exposure gradually, aligning with broader capital reallocation trends.
Whale Wallets Signal Strategic Accumulation
Meanwhile, wallets holding over 1,000 BTC rose to 1,455 in May 2025. This increase suggests renewed confidence among whales, which include funds, exchanges, and early adopters. These addresses hold 8.4 million BTC, representing 40% of the total circulating supply.
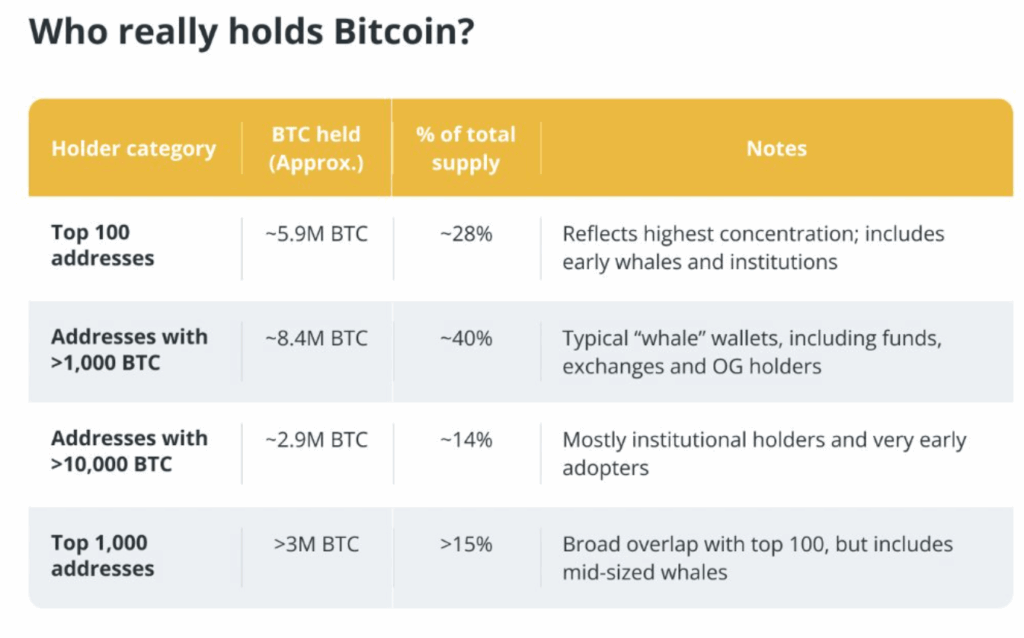
The top 100 Bitcoin addresses control approximately 5.9 million BTC, or 28% of the total supply. This group includes major institutions, early miners, and strategic holders with limited trading activity.
Over 3 million BTC is also held across the top 1,000 addresses, reinforcing strong long-term conviction. Around 2.9 million BTC sits in wallets holding more than 10,000 BTC, dominated by institutions and early adopters.
This concentration continues to grow alongside consistent accumulation activity shown by on-chain metrics. Large holders are increasing stakes during periods of weak retail participation.
RSI Flashes Hidden Bullish Divergence on Bitcoin Chart
Bitcoin showed a hidden bullish divergence based on RSI behaviour on the daily chart. The price has formed a higher low, while RSI prints a lower low, a typical bullish continuation pattern. This technical signal last appeared in 2024, leading to a 60% rally within weeks.
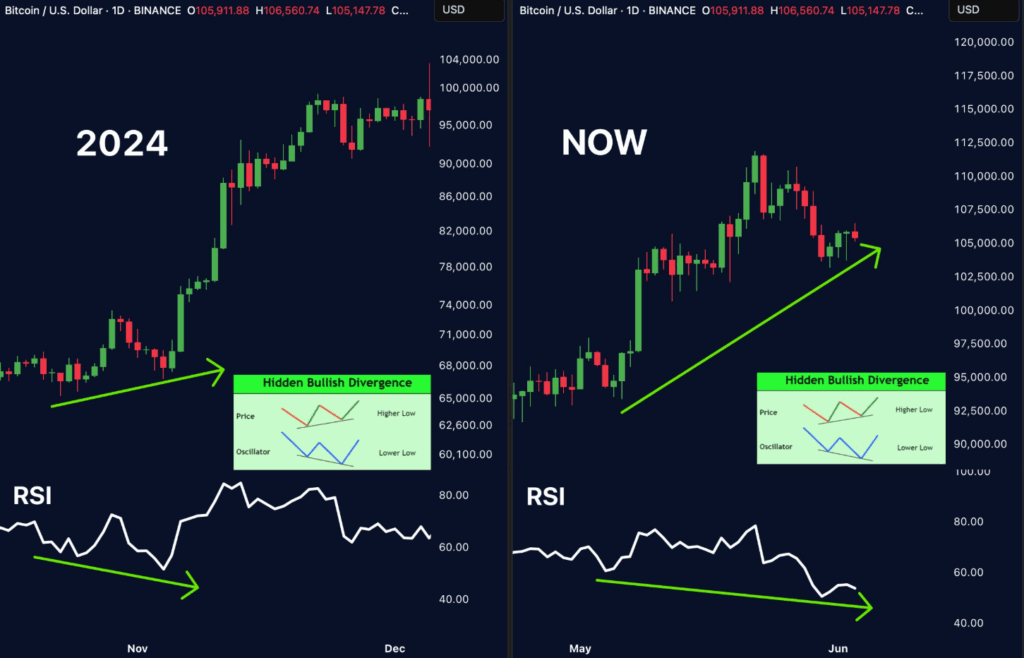
Current market conditions resemble the 2024 setup, with strong underlying structure and stable accumulation. Price consolidation near $105,000 continues despite rising institutional activity and stable macro support.
Further price appreciation could follow if the RSI signal plays out as momentum rebuilds. On the other hand, Global liquidity has expanded. Also, the BTC price continued to follow the growth of the M2 money supply.
The M2 chart revealed a consistent rise in money supply since 2023. This trend contributes to the broader revaluation of assets.



