
 astronaut
 Zylo Ecosystem
 Pearl
Pearl Bitcoin
 Quantus
 Pudgy Penguins
 Bitway

Key Insights:
- SEI price holds above $0.1850 support, with upside target near $0.30 if strength persists.
- Ranked 3 by bridged net flows, SEI sees $2.7M inflow, beating Bitcoin and Arbitrum.
- The derivatives market shows a rising long bias with funding rates turning positive on SEI pairs.
SEI price held above a critical short-term support near $0.1850 despite broader market pressure. At press time, SEI traded at $0.188, recovering from intraweek lows. According to analysts and on-chain data, a move toward $0.30 remains possible if the support level holds in the short term.
SEI Price Structure Remains Intact Near $0.1850
Analyst Michaël van de Poppe emphasized that SEI price remains one of the strongest-performing tokens amid the market pullback. He pinpointed the region of $0.1850 as a critical level to monitor. In his analysis, if SEI price maintains that support, the price could initiate a bullish continuation toward the $0.30 resistance zone.
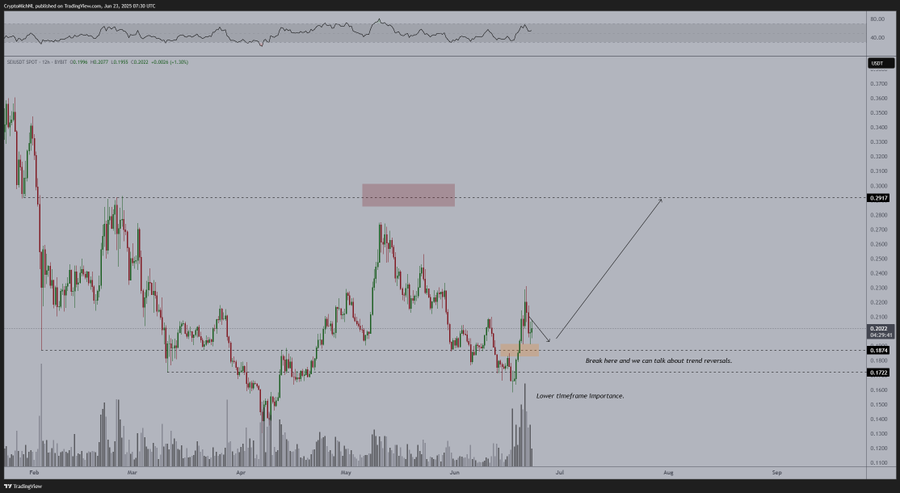
The chart provided generates a straightforward breakout opportunity with a clear diagonal projection to $0.30, which would hinge on the stability of the price around or above the level of $0.1850. The RSI representing the same period is neutral, indicating further price gains in case the demand returns. Van de Poppe expanded, “Break this and we can discuss reversals of trend, above $0.22.”
The volume data validates that the buyers had been protecting the level on several dips. The rebound off sub-0.18 low made a higher low pattern and indicates a fresh bullish momentum. Nevertheless, given the inability to hit above the level of $0.2150, the breakout situation could be delayed.
Smart Money Flows Signal Institutional Interest
According to Artemis data, SEI recently ranked third among all blockchains in terms of 24-hour net bridge inflows. It recorded an increase of over 2.7 million in fresh capital, only behind Ethereum and Base. This influx of funds indicates growing investor confidence in the Sei Network during a volatile market phase.
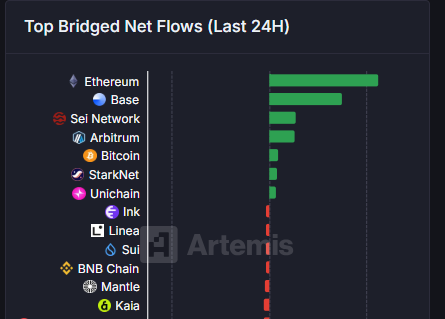
Smart money flows to emerging networks during uncertain macro conditions, often signaling a buildup of positions ahead of a potential move. With Bitcoin and other majors in consolidation or decline, SEI’s rising bridge activity suggests capital rotation into smaller caps.
The chart shared shows SEI leading other established chains like Arbitrum, Sui, and Starknet in net flow rankings. This further reinforces the possibility that institutional capital may be preparing for a longer-term position, supporting bullish SEI price action.
Derivatives Data Confirms Bullish Bias
According to CoinGlass data, it revealed that long positions dominate the SEI market. Long/short ratio is 0.989 after 24 hours, and the long position is also preferred by the strongest traders at Binance. The ratio on Binance accounts is 1.8225, indicating the possibility of being bullish despite the recent volatility in prices.
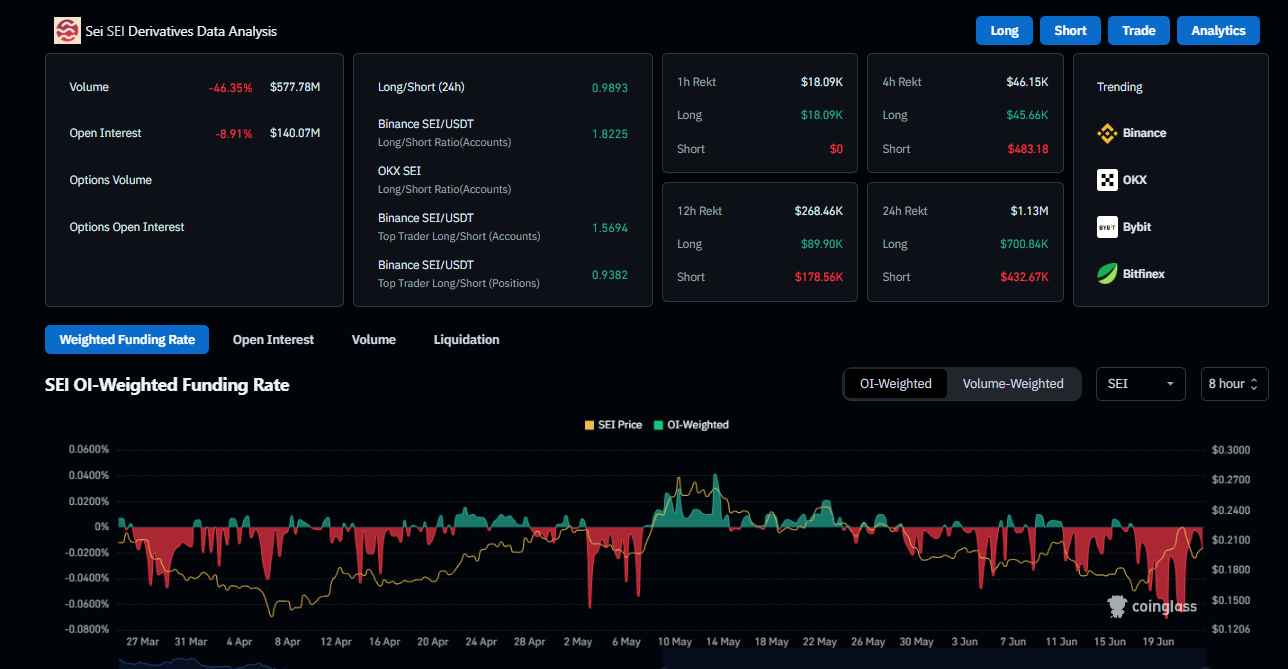
Moreover, the open interest has fallen 8.91% to 140.07 million, which is a normal trend in the period of consolidations. However, the funding rates are floating just above zero on OI-weighted charts, a reading that shows that it is neutral-to-bullish. Investors are preparing themselves to experience a breakout, but at the same time, they are keeping the leverage as low as possible.
Particularly, the long liquidations are low with only 18.09K rekt in the last hour, with no short liquidations. Over the past 24 hours, long liquidations amount to $700.84K relative to shorts of $432.67K, with the latter suggesting the prevalence of bulls. This one-sided pressure encourages a slow drift towards the upside in case market conditions are favorable.
Resistance Zone and Reversal Setup Toward $0.30
However, going past $0.2150, the next structural resistance is at around $0.26 to $0.30. The area has, at times in April and May, served as a supply region, yet the recent arrangement indicates weakening seller power.
The chart envisions a clean breakout out of the existing range to $0.30. The main criterion will be the maintenance of a tight range above $0.2150 on the daily candles. Failure to follow through above can lead to a move sideways or retesting of the previous support of $0.1850.
Disclaimer
This article is for informational purposes only and provides no financial, investment, or other advice. The author or any people mentioned in this article are not responsible for any financial loss that may occur from investing in or trading. Please do your research before making any financial decisions.





