
 Altai the Tiger
 IGNITION
 streamoors
 NEAR Protocol
 Sui
Sui Ethereum
 Pudgy Penguins
Key Insights:
- The U.S. has announced a 30% tariff on South Africa and Malaysia, and a 25% tariff on Japan and South Korea.
- Bitcoin (BTC) has formed a bearish engulfing pattern at a key resistance level, indicating a potential price decline.
- Despite the bearish outlook, investors and long-term holders have potentially accumulated $63 million worth of BTC.
Global tariff tensions are once again raising concerns about a potential market shift and sentiment, which had improved over the past few months.

According to the latest report, the U.S. government has imposed a 30% tariff on South Africa and Malaysia, and a 25% tariff on Japan and South Korea.
Is Tariff Tension Behind Bitcoin (BTC) Fall?
These aggressive trade measures have shaken traditional markets and now appear to be impacting the crypto space as well.
Following this announcement, overall cryptocurrency market sentiment has weakened once again. A major asset like Bitcoin (BTC) appears to be forming a bearish candlestick pattern near its all-time high.
At press time, BTC was trading near $108,380 and had recorded a price drop of over 0.75% in the past 24 hours. However, the price has significantly recovered since the opening bell of the Asian trading session.
CoinMarketCap data reveals that during the morning hours, BTC price hit its intraday low of $107,586 but now appears to be recovering. As a result, investors and traders are uncertain whether this price recovery will continue or if it is just a temporary correction.
Given the current market sentiment and recent tariff tensions, trader and investor participation has declined. It resulted in a 15% drop in recorded trading volume.
Bitcoin (BTC) Technical Analysis and Upcoming Levels
According to expert technical analysis, Bitcoin (BTC) appears to be struggling near its all-time high of $111,970. Additionally, the chart shows that this is the fifth consecutive day BTC has been trading within a narrow range between $107,450 and $109,880.
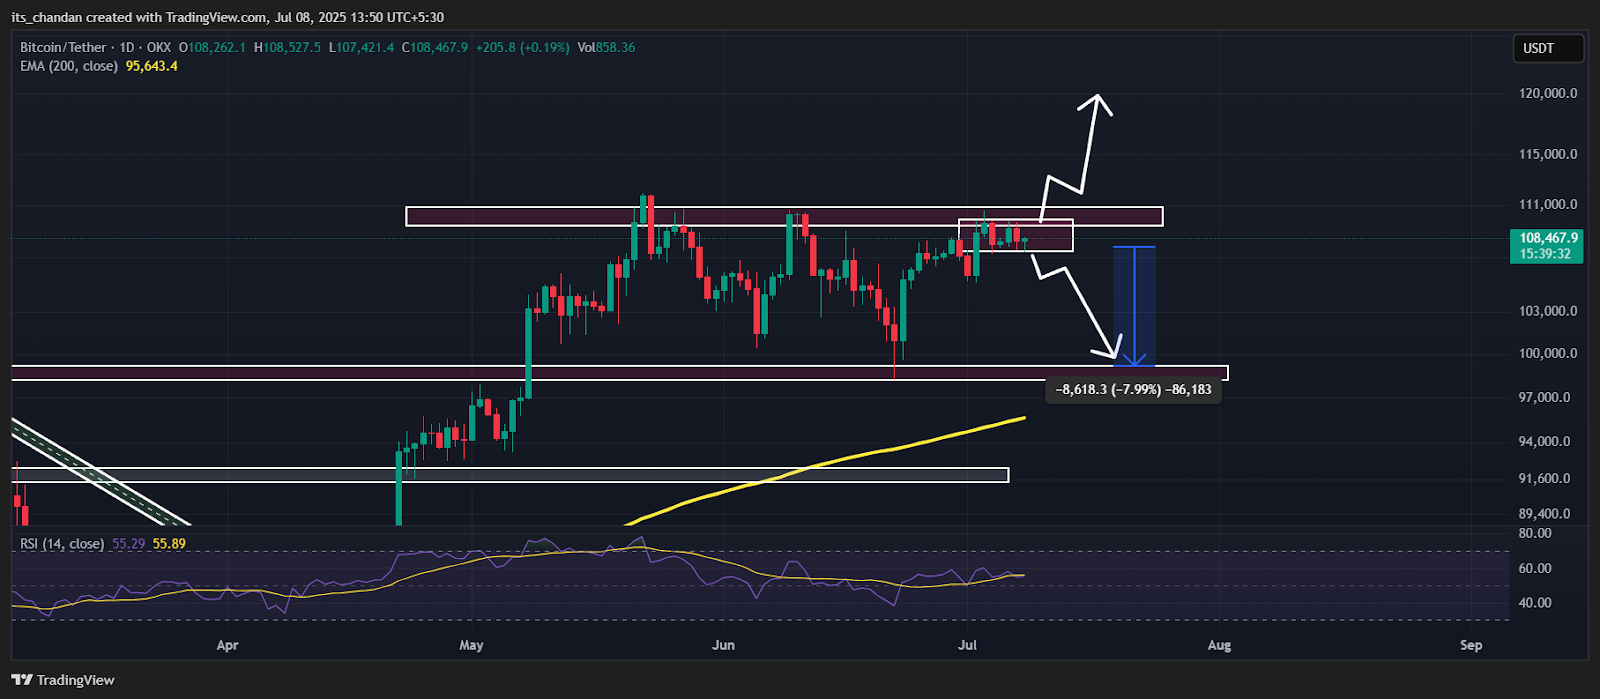
The current price consolidation near this key resistance level could be setting the stage for either a sharp correction or a breakout to a new all-time high.
Based on recent price action and historical patterns, if Bitcoin breaks down from this consolidation and closes a daily candle below the $107,450 level, it could experience a notable decline. In that scenario, there is a strong possibility that BTC could drop by 8%, potentially reaching $100,000 or even lower.
On the other hand, if BTC breaches the resistance and closes a daily candle above $109,900, it could pave the way for a new all-time high.
Technical Analysis: 200-Day EMA and RSI Insights
At press time, BTC price was trading above the 200-day Exponential Moving Average (EMA) on the daily time frame. This indicates that the asset is in an uptrend. It also hints that the bullish sentiment remains strong, with potential for further upside if key resistance levels are broken.
Whereas, the Relative Strength Index (RSI) stands at 55. It indicates the market is in neutral territory with room for either upward or downward movement.
$63.45 Million Worth of BTC Leave Exchanges
Despite concerns of a price drop amid ongoing tariff tensions, investors and traders have shown strong interest in the asset, as accumulation activity has been observed.
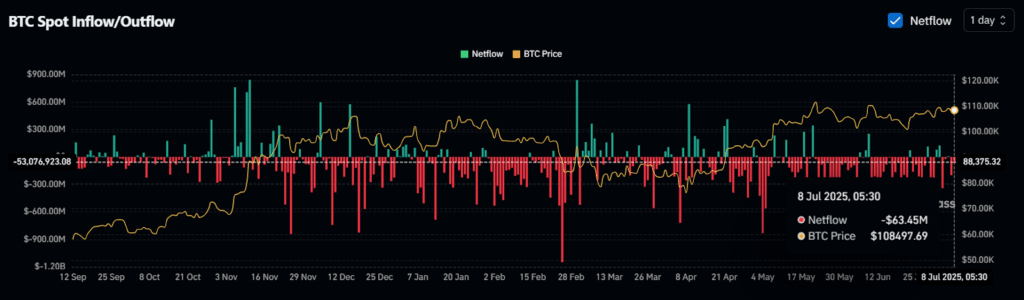
Data from spot inflow/outflow reveals that exchanges across the cryptocurrency landscape recorded a significant outflow of $63.45 million worth of BTC in the past 24 hours.
This substantial outflow, amid the current market sentiment, suggests potential accumulation. It may also help reduce selling pressure.
Disclaimer
This article is for informational purposes only and provides no financial, investment, or other advice. The author or any people mentioned in this article are not responsible for any financial loss that may occur from investing in or trading. Please do your research before making any financial decisions.




