
 Zylo Ecosystem
 astronaut
 Pearl
Pearl Walrus
 Starknet
 Pudgy Penguins
 Bitcoin

Key Insights:
- Ethereum price rallies as institutional investment strengthens market momentum.
- GameSquare invests $100 million in Ethereum-focused treasury vehicles.
- Short-term resistance at $2,600 is key for Ethereum’s price action.
Ethereum price has shown significant action in the past days, increasing by 5% over a single day. Data indicates that the ETH is about to reach the $2,600 mark. This is an essential psychological threshold that most traders and investors are paying attention to.
The development of institutional interest and market dynamics explains the increase. This prepares the ground for possible further price development.
Institutional Interest Drives the Bullish Momentum for Ethereum Price
GameSquare, which is trading on the Nasdaq, has authorized a gradual investment of up to $100 Million in ETH. The move shows institutional support for the value proposition of Ethereum in the long term.
GameSquare may use Ethereum-based strategies to generate yield in its new treasury vehicle. These gains could be converted into stablecoins or invested in NFTs.

Such a portfolio variety of Ethereum investments solidifies its market presence. It also highlights its increased adoption by institutional investors as such an asset class.
Despite the drop in retention rates, we can observe a steady improvement in the Ethereum price chart. The token’s price has achieved a resistance at $2,500 in the recent past.
However, since then, it has managed to propel and reach the mark of $2,600. The recent trend shows positive momentum with the green candlestick, meaning buyers control the situation.
The current rally poses a possible short-term resistance area for $2,600. Failure to clear this resistance may lead to a consolidation trend or a minor correction.
Nevertheless, ETH has been keenly supported at the $2500 price level. Also, the market recognizes the value at this price range.
Ethereum’s Market Data Show Strengthening Fundamentals
Ethereum’s 24-hour trading volume is $18.31 Billion at press time. This marks an increase of 11.49%. The data comes from CoinMarketCap. Over the past week, the upswing in purchasing activity could influence the current Ethereum price movement.
During big price swings, many long positions get closed or liquidated. This shows how quickly bullish bets unravel in volatile markets.
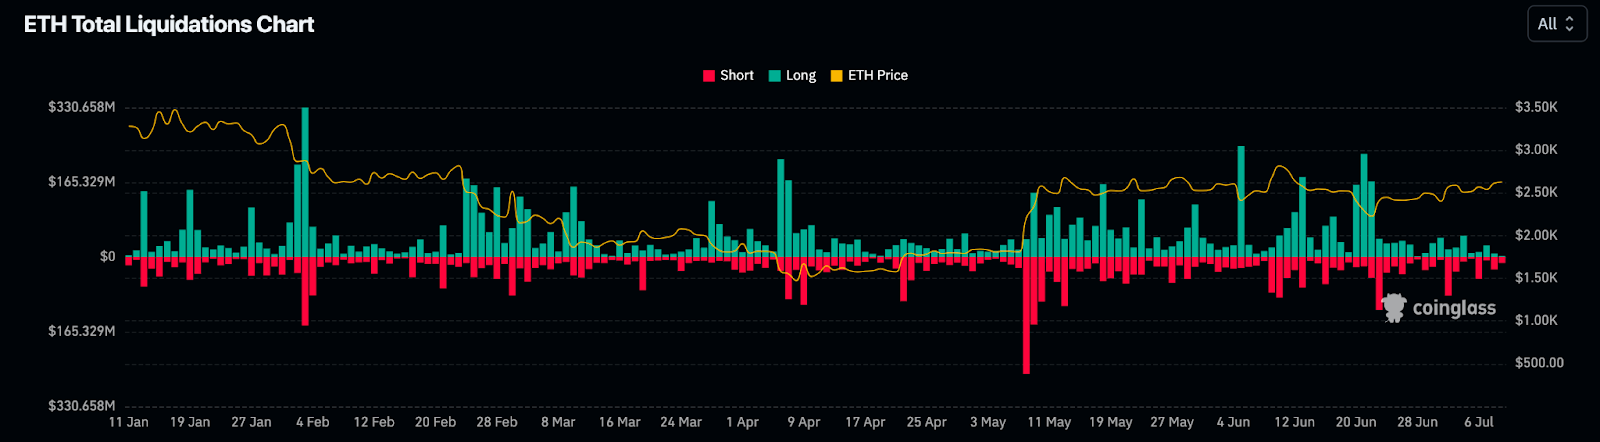
There has been a significant directional price movement in the ETH market and the liquidation figures. This shows that the traders have been under intense pressure in the market.
The chart shows that the long positions have been especially at risk of forced liquidation during these price swings. The liquidation figures have been immense when the price has rapidly shifted.
What this implies is that most traders were over-leveraged. This could have contributed to the volatility experienced in the market.
Ethereum Price Shows a Rising Wedge Pattern
On the 4-hour chart, Ethereum price shows a definite image of a rising wedge. This technical pattern anticipates a possible reversing signal of a prolonged bull run.
This pattern has two diverging Trend Lines that make a narrowing price range. The rising wedge pattern indicates that the pace of advancement is slowing despite the price being advanced. This means that the bullish momentum may come to an end.
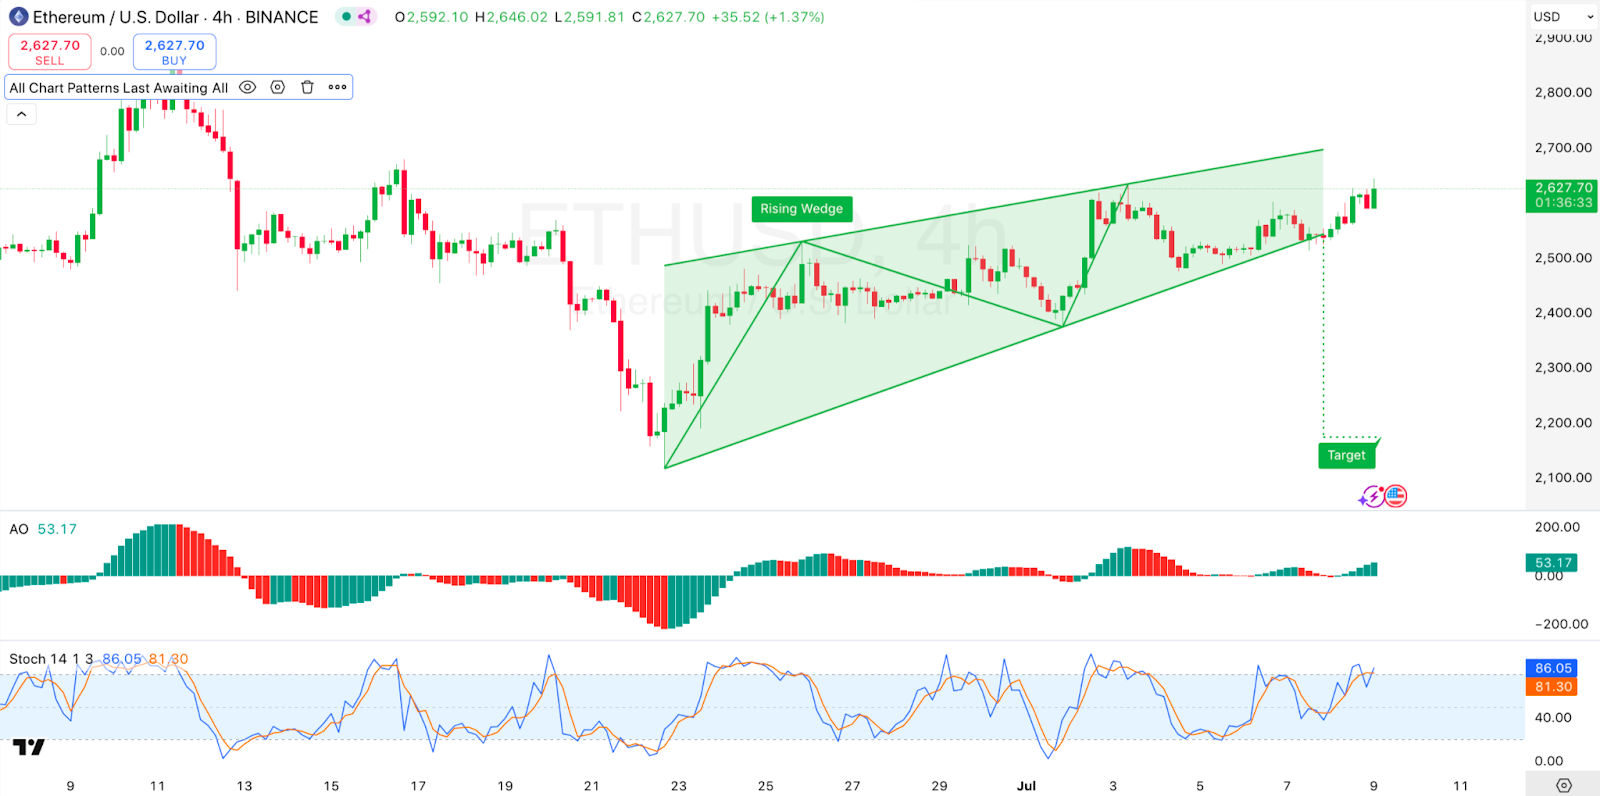
With ETH, the rising wedge formation indicates a potential for a price adjustment. This is especially when the Ethereum price comes closer to the upper trendline.
If the rising wedge plays out, target levels may fall between $2,400 and $2,500. These levels are below the current trading range. It’s important to note that such chart patterns are not always predictive.
The market’s actual direction will depend on future developments. ETH may either climb higher or face downward pressure. The Awesome Oscillator is currently showing green bars, which suggests bullish action on the Ethereum price.
The Stochastic RSI is currently in the overbought region, showing massive bullish pressure. The technical factors and the continued institutional investment could push ETH far.
However, some whales have been dumped. The bullish pressure could dwindle to an extended consolidation period if this continues.
Disclaimer
This article is for informational purposes only and provides no financial, investment, or other advice. The author or any people mentioned in this article are not responsible for any financial loss that may occur from investing in or trading. Please do your research before making any financial decisions.




