
 Altai the Tiger
 IGNITION
 streamoors
 Sword Inu
 NEAR Protocol
 Injective
 Quantus

Key Insights:
- Ethereum price breakout above $2.9K signals strong bullish momentum.
- BlackRock’s ETH ETF boosts institutional confidence and weekly inflows.
- Sustained open interest growth confirms rising trader conviction in ETH.
Ethereum price surged over 20% this week, reclaiming the $3,000 mark for the first time since February. This rise followed strong momentum in the broader cryptocurrency market and growing optimism around Ethereum-based ETFs.
The successful break of the ETH above the important resistance zone of 2,900 units shows a similar trend in Bitcoin. Evaluators indicate that this step brought the ETH price close to the $4,000 mark, should the trend prevail.
Investors’ sentiment has improved dramatically with the role of institutional interest. The Ethereum ETF produced by BlackRock hit the news flow by placing sixth in the weekly inflows charts.
The preparation indicates significant capital inflow and reaffirms institutional trust in the long-term prospects of ETH. This recent spike is also attributed to increased trading and purchasing pressure within ETH-related ETFs.
Nevertheless, certain analysts are cautious against possible opposition since investors will begin to take some profits at higher levels. Nonetheless, ETH remains resilient, as good market fundamentals and demand among investors support it.
Ethereum Price Breakout: Analyst Eyes $4000 Surge
A crypto analyst pointed out a significant technical event with the Ethereum price. This is because the digital currency rose above an essential stoppage. ETH price has broken through its firm resistance level of $2,800. Analysts now see upward momentum building on its daily chart.
The breakout is a major one, a possible continuation pattern sign of a bull. The chart has some technical indicators that show increasing strength. Ethereum price broke the resistance zone with a substantial volume and power.
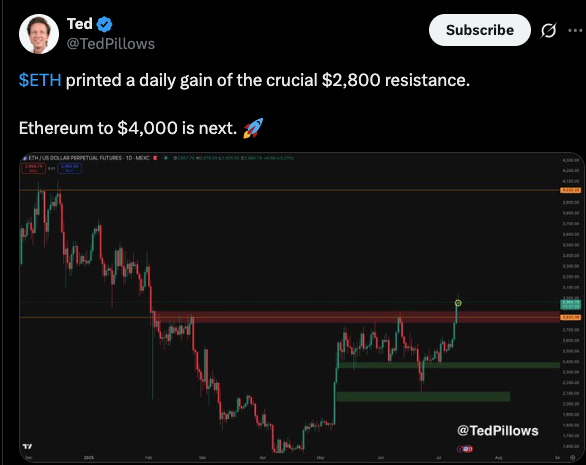
This move in prices has stoked optimism in the market. Analysts think the ETH price might aim at the $4,000 mark should the momentum continue.
He noted that the breakout could spark more buying activity. Traders and investors may react quickly to the bullish technical setup.
Ethereum Open Interest Surge Signals Volatility
Ethereum futures open interest is also experiencing a dizzying rally. It is indicative of possible market shakeups within the next few days. Crypto Rover shared a chart with data from CryptoQuant.
It shows that Ethereum’s open interest across all exchanges is climbing to a level not seen in months. This surge signals renewed activity and growing market anticipation.
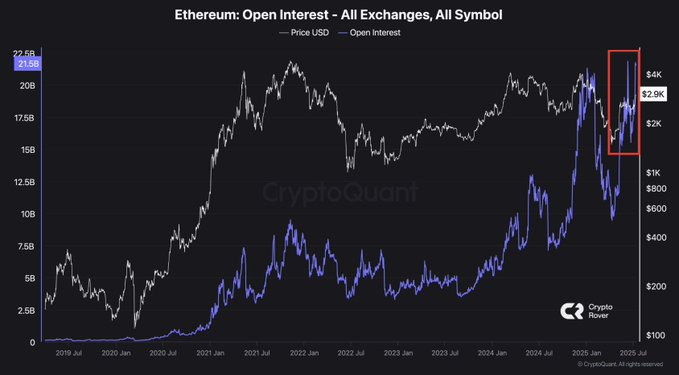
This increase in open interest usually indicates an increase in leveraged positions. Also, it suggests that traders are positioning themselves to expect a sharp price move.
Ethereum Price Breaks Resistance, Signals Bullish Reversal
Ethereum price reported a V-shaped recovery during the daily timeframe, and bullish confidence was restored. As per the latest technical reports, ETH price has conquered one of the most vital neckline resistances uproariously.
This breakout is backed by good momentum and an additional amount of volume. This means traders have a lasting buying interest.
The market is still on the upward trend following a long consolidation period. Also, the ETH is above both the 9-day EMA and 50-day SMA. Market observers closely watch the price action as the cryptocurrency pushes toward the $3,000 mark.
ETH Holds Above $2,800 Amid Bullish Momentum
ETH price was trading at $2,941 on July 12 after a brief pullback from $3,000. The Relative Strength Index (RSI) recently climbed as high as 76, indicating overbought conditions.
It has since cooled off to 65, hinting at a minor correction or possible consolidation. The Chaikin Money Flow (CMF) stood positive at 0.11. This implied a continued inflow of capital into Ethereum.
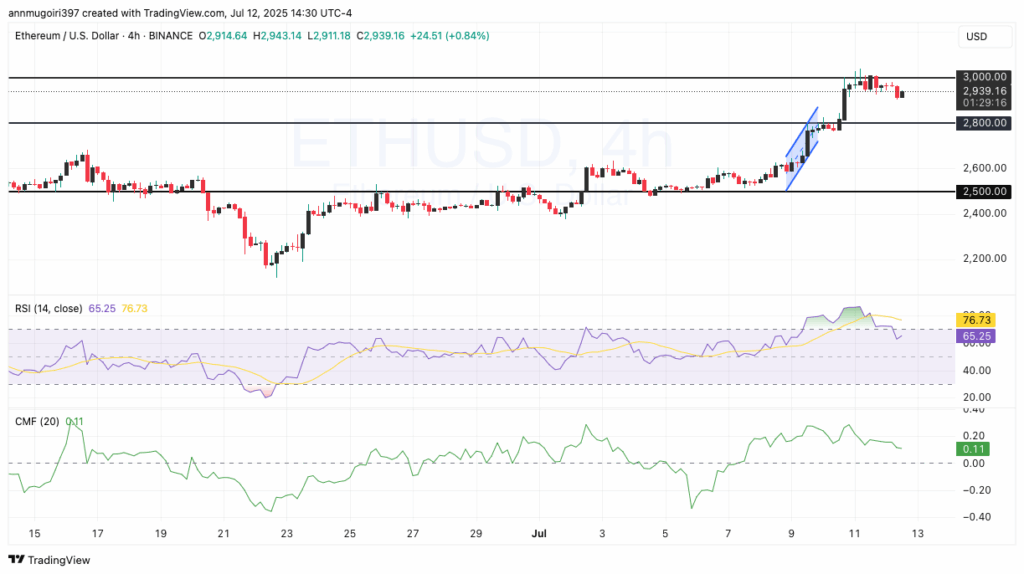
If the Ethereum price is above $2,800, bulls could attempt another push toward the psychological barrier of $3,000. A confirmed breakout above $3,000 could open the path toward $3,200 in the short term.
However, failure to sustain current levels might trigger a correction toward the $2,800 support. A deeper drop could revisit $2,600, where previous consolidation occurred.
Disclaimer
This article is for informational purposes only and provides no financial, investment, or other advice. The author or any people mentioned in this article are not responsible for any financial loss that may occur from investing in or trading. Please do your research before making any financial decisions.




