
 Altai the Tiger
 IGNITION
 streamoors
 NEAR Protocol
 Sui
Sui Ethereum
 Pudgy Penguins

Key Insights:
- Cardano price nears $0.83 resistance, and a breakout may trigger a move toward $0.85 and $1.05.
- The ADA weekly chart confirms a buy signal with a trendline break and Parabolic SAR flip.
- Cardano $0.60–$0.70 accumulation zone held strong, forming a base for bullish continuation.
Cardano price has entered a critical zone as it consolidated near $0.76. The $0.83 resistance wall stands as the next key hurdle. Nevertheless, if bulls breach that wall, traders are expecting an intense rally to $0.85 and $1.05.
Cardano Price Approaches $0.83 Resistance
Cardano price structure has turned decisively bullish after printing a series of higher lows since early July. It was pushing toward the major resistance zone at $0.83 at press time. That level has rejected multiple rallies in Q2.
Notably, CW claimed that this area is a major sell wall. When flipped, it can initiate a swift price discovery to the next significant level at $0.85.
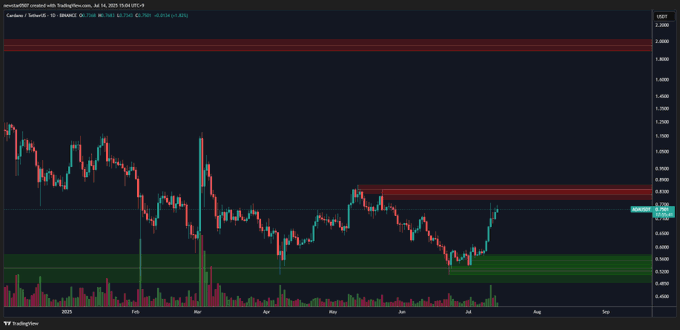
During upswings, volume has also been increasing, and it is an assurance that real buyers are entering. The demand zone of $0.68 to 0.$72 remained strong and provided support to the recent rally. With Cardano price currently trading around $0.75, momentum has shifted in favor of the bulls.
Moreover, the daily chart highlighted solid bullish continuation. ADA price is above key moving averages, and the market structure keeps forming support at former local highs.
Cardano Price Breakout Above $0.85 May Trigger a Rally to $1.05
In addition, Mintern also highlighted the resistance level of $0.83-$0.85. In his latest chart, ADA price respected short-term bullish structure with a hold above the 7- and 14-period moving averages. He stated a Cardano price break above $0.85 could “quickly send ADA toward $1.00 or even higher.”
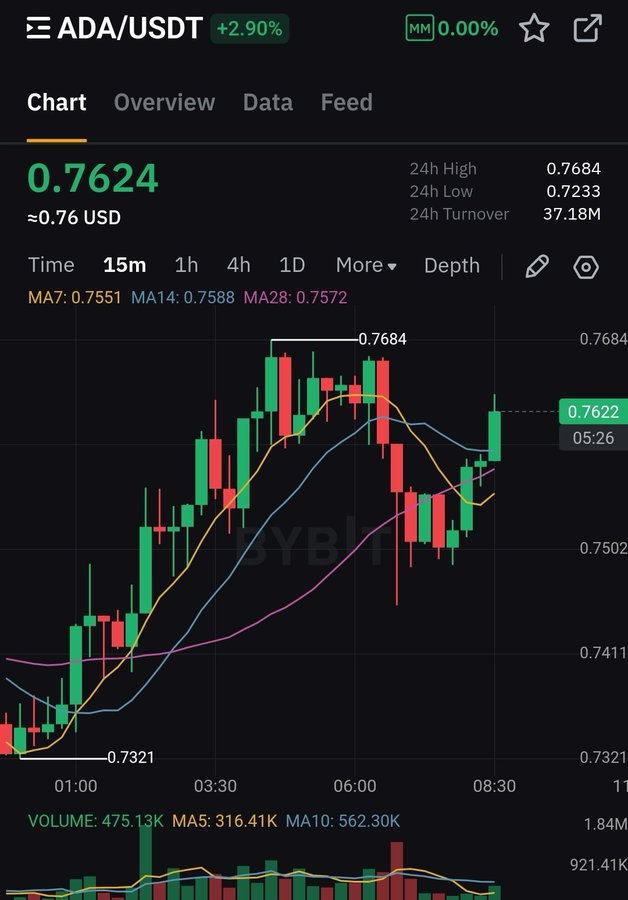
The microstructure confirmed this view as Cardano price has formed a mini bull flag, and volume remained elevated during green candles. Above the $0.85 level, liquidity is becoming thin. So, a breakout would have a way to go before hitting much resistance. It makes the current zone critical.
Interestingly, if Cardano price clears $0.85, historical targets from earlier cycles suggest $1.05 and $1.23 could come into play. The setup now resembles past rallies where ADA price consolidated under key resistance before launching 20–30% higher within a few days.
Weekly Buy Signal Confirms Reversal Structure
Adding to the bullish case, Jesse Olson confirmed a buy signal on ADA weekly chart. The chart had a break of a long-term downward trendline, bullish cross momentum, and a Parabolic Sar flip. All indicators point to a structural trend reversal.
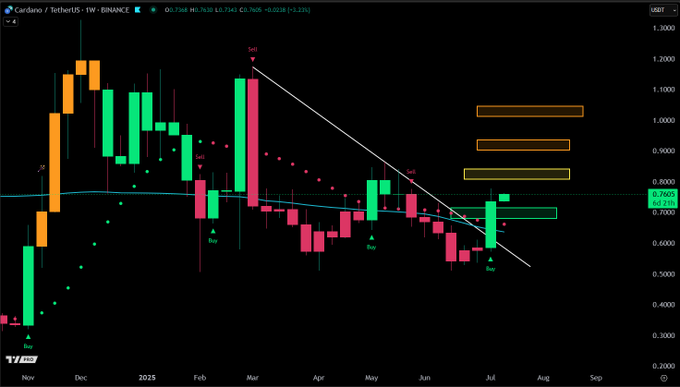
He provided three major upside targets of $0.85, $1.05, and $1.23, all coinciding with previous volume nodes. According to Olson, it is the first weekly close above trendline resistance on a candle since March 2025. It confirms that Cardano price is regaining strength on low and high timeframes.
Weekly RSI is now also above the 50 level, showing bullish momentum. If ADA price closes this week above $0.75, traders could view it as confirmation of a new mid-cycle uptrend. This move has a solid touch of confluence as it has the daily and weekly signals converged.
Cardano Price Supported by 70% Long Positioning
The futures positioning has now strongly shifted to the bulls. According to Binance ADA/USDT perpetual data, 70% of traders are currently holding long positions. Only 30% are short accounts, and the long/short ratio is 2.33.
This change indicated that the majority of traders are likely to have a resistance break.
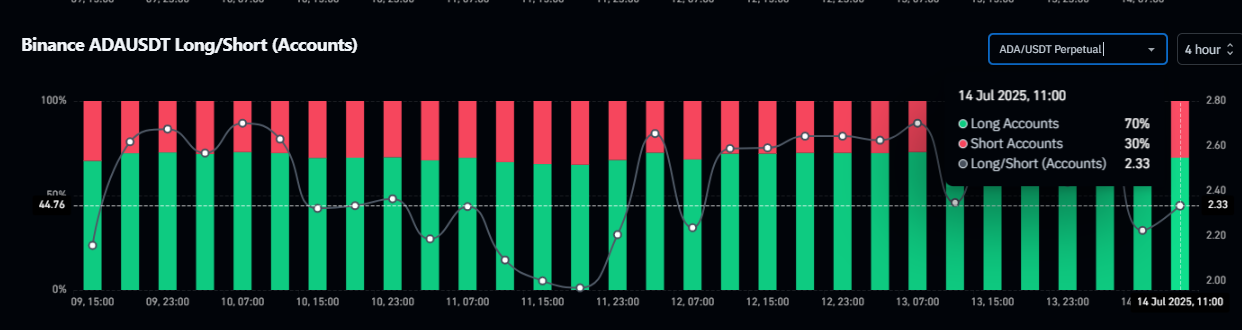
The sudden increase in long interest also came during the recent boom in the spot volumes. In case of alignment of futures and spot flows, the breakouts have greater weight. Such a long bias also signifies the confidence among the high-leverage traders.
Further, the rise in long interest has been gradual, which suggests that smart money is positioning itself slowly. These arrangements in the past have been a precursor to breakout rallies, particularly in combination with objective technical form and increasing volume.
As Cardano price continued pressing against resistance, this alignment further supports the bullish thesis.
Disclaimer
This article is for informational purposes only and provides no financial, investment, or other advice. The author or any people mentioned in this article are not responsible for any financial loss that may occur from investing in or trading. Please do your research before making any financial decisions.




