
 streamoors
 IGNITION
 Injective
 NEAR Protocol
 Quantus
 Pearl
Pearl Aerodrome Finance
Key Insights:
- Nvidia stock price fell slightly in the last 24 hours after hitting its ATH of $174 as of press time.
- The Nvidia stock outpaced Microsoft, Apple and Google by market capitalization and by forward price to earnings per share.
- The Nvidia stock price chart continued to show bullish strength.
Nvidia stock (NVDA) has been one of the best-performing due to its affiliation in AI, crypto, web3, and the technology space. The token is one to watch, especially after the recent update about its H20 GPU exports to China that had gotten a green light from the U.S. authorities.
The Chinese market plays a crucial role in the advancement of the Nvidia technology mainly because most the workforce that deals with improvement is based there.
Therefore, following the green light, Nvidia stock has been making highs after highs, suggesting the strength of the asset in the long term. That said, its worth assessing more details about the stock.
Nvidia Stock vs Other Tech Stocks
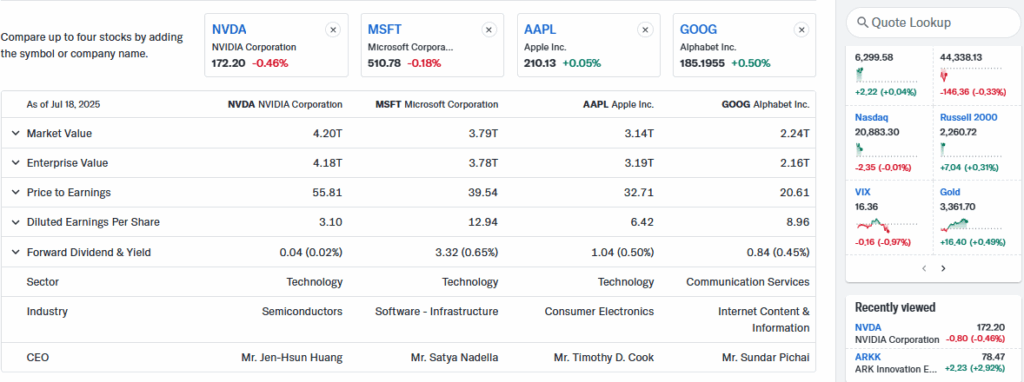
Nvidia’s stock has beaten three of its fierce competitors, Microsoft (MSFT), Apple (AAPL), and Google (GOOG), in terms of market capitalization. The market value NVDA stock was 4.2 trillion, as the rest followed with $3.79T, $3.14T, and $2.24T, respectively.
Nevertheless, the Nvidia stock had just dipped a bit in price to a new level of $172.20 a share. This was after the stock reached an all-time high (ATH) of $174.
At the time of writing, Nvidia’s price-to-earnings ratio (P/E) was 55.81. This showed that Nvidia stock outpaced MSFT, AAPL, and GOOG at 39.54, 32.71, and 20.61, respectively. This indicated the investors’ optimism about the company’s good growth.
With the stock earning a commission of $148.51 billion in 2025, it saw an outstanding growth rate of 69.18% within a year.
Additionally, Nvidia stock registered a gross profit of $104.12 billion, which meant the firm was very profitable.
For its 3-month and Year-to-date performance, NVDA stock was impressive with a growth of 69.51% and 28.12%, respectively, and 4.31% in the last week.
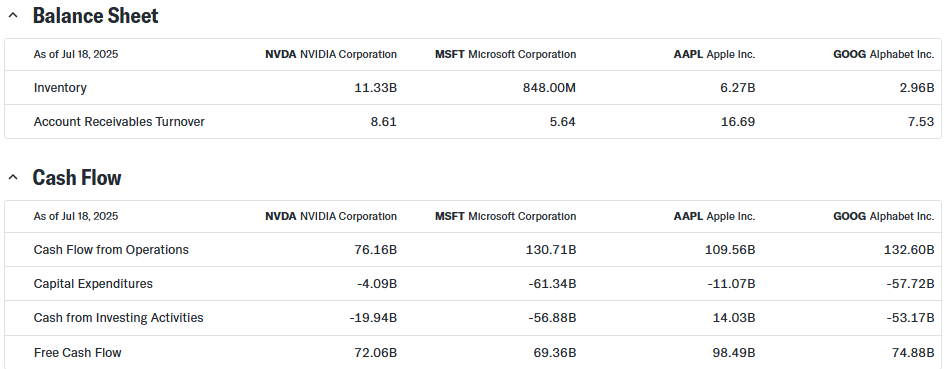
Although its price has decreased slightly after its ATH, its cash flow of operations stood strong at $76.16 billion. The free cash flow was $72.06 billion, less than that of AAPL and GOOG as per Yahoo Finance data.
Nvidia’s stock also enjoyed the biggest profit margin among its rivals, with 51.69% against 35.79%, 24.30% and 30.86% for MSFT, AAPL, and GOOG, respectively.
Such a high market price and its growth, together with Nvidia’s record growth in sales and financial health, made NVDA stock one of the leaders in the semiconductor market.
Nvidia Stock Price Analysis
Wearing technical lenses, Nvidia stock chart showed that the asset traded at $171.54 as of press time. The Bollinger Bands were showing an upward trend, further uplifting at $174.25.
However, the analysis showed that NVDA was trading almost at the top of the bands, so either a pullback or a consolidation could be expected.
Meanwhile, the trading volume was downward, indicating declining interest in the stock. The daily trading volume came to about $2.51 billion from a high of $10B toward the end of January.
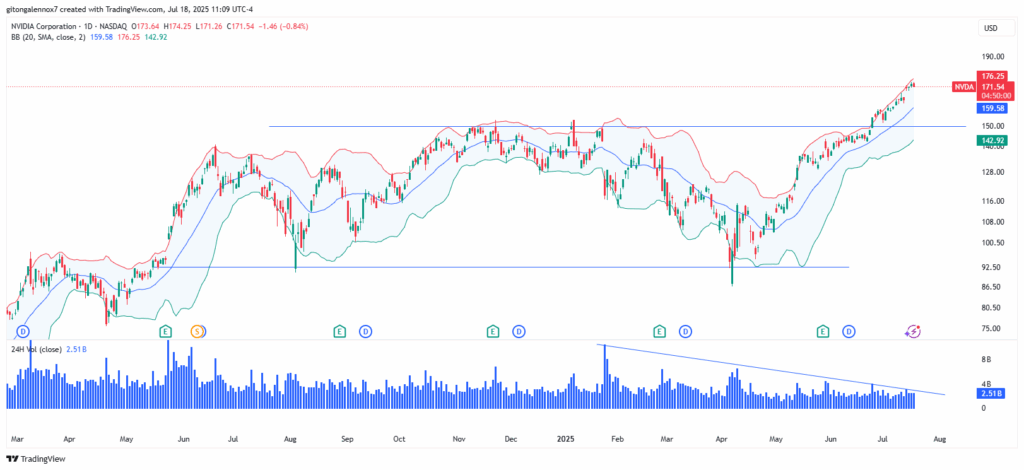
Since the price was moving way above the middle Bollinger Band at $159, it indicated a good bullish momentum. Nevertheless, the decline in the volume might be an interpreter of fatigue.
If the stock persistently rose beyond the resistance point at $174, a connotation of even greater bullishness would be occasioned. However, a retreat towards $142 support would not be ruled out as the price stabilizes.
Disclaimer
This article is for informational purposes only and provides no financial, investment, or other advice. The author or any people mentioned in this article are not responsible for any financial loss that may occur from investing in or trading. Please do your research before making any financial decisions.




