Altai the Tiger
 IGNITION
 streamoors
 Sword Inu
 NEAR Protocol
 Injective
 Quantus
Bitcoin (BTC) has finally ended its sideways momentum, which it had been experiencing since reaching an all-time high. According to the four-hour chart, the asset was moving within a descending channel pattern.
Bitcoin’s Recent Breakout and Current Price Momentum
However, this sideways pattern has now broken, and BTC appears ready to climb again and potentially hit a new high.
Today, on July 28, 2025, Bitcoin is hovering near $119,260 and has made a decent 1% jump over the past 24 hours.
This price surge and the end of the sideways movement have boosted participation from traders and investors, resulting in a 20% increase in recorded trading volume.
Bitcoin (BTC) Price Action and Technical Analysis
According to expert technical analysis, Bitcoin has recently broken out of a descending channel pattern formed on the four-hour timeframe.
Following the breakout, the chart isn’t flashing any bullish confirmation yet. However, a confirmation could be seen if the asset closes a four-hour candle above the $120,000 level.
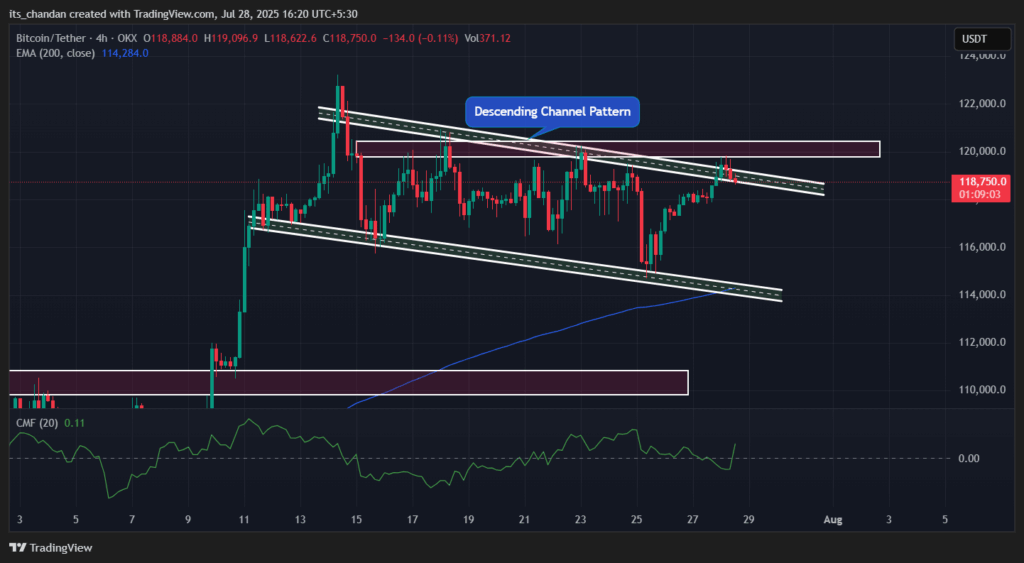
Based on price action and historical patterns, despite the breakout, $120,000 appears to be a key resistance level that could pose a hurdle for the asset. If BTC’s upward momentum continues and breaches this $120,000 level, it could signal a continuation to the upside, potentially leading to a new all-time high.
Given the current market sentiment, BTC’s CMF (Chaikin Money Flow) stands at -0.10, indicating mild selling pressure and a lack of strong buying interest, which could suggest a potential slowdown in bullish momentum.
Whereas the Relative Strength Index (RSI) stands at 59, approaching the overbought territory, it could signal a bullish continuation if buying pressure increases in the market.
Expert Bold Prediction for Bitcoin Price
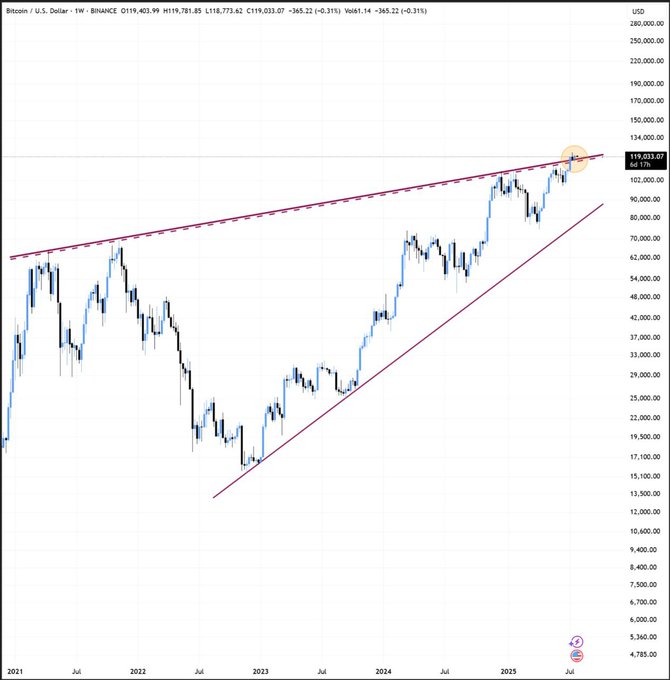
Amid this bullish outlook, experts and analysts are making bold predictions that have recently surfaced on X (formerly Twitter). In one post, an expert noted that with the recent breakout, BTC is now engaging with another major resistance level formed by a trendline.
According to the post, the $119,500 level appears to be a strong resistance zone, but there is a strong possibility that BTC could soon break through it. If this happens and the price closes a daily or weekly candle above the $119,500 mark, BTC could reach $135,000 within 1–2 weeks.
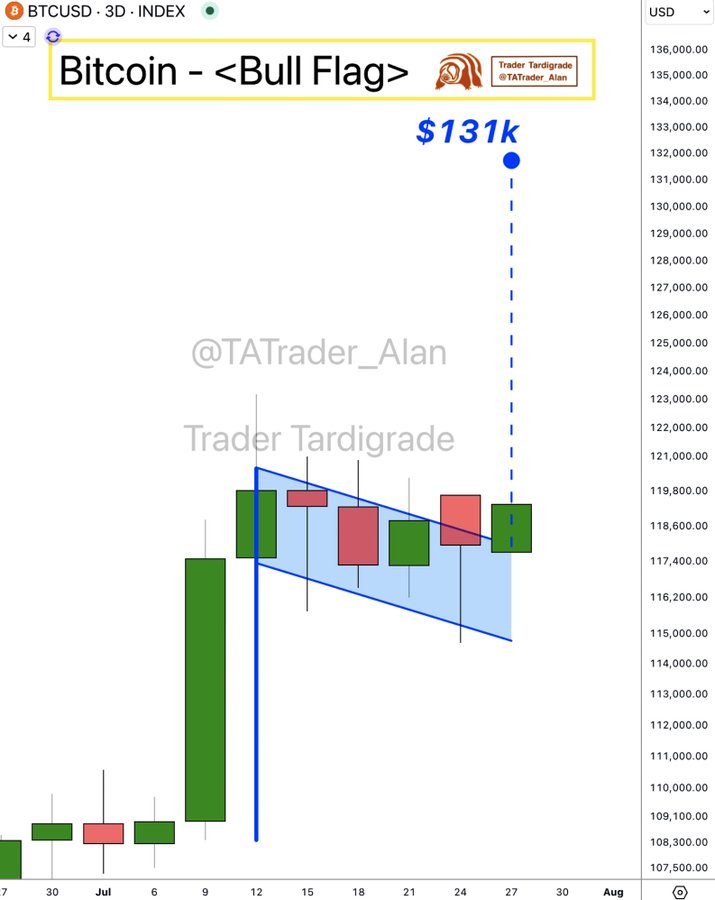
In addition, another crypto expert shared that Bitcoin has broken out of a bullish flag pattern and is targeting the $131,000 level. Meanwhile, another analyst claimed that Bitcoin has broken out of a bullish pattern and a new all-time high is incoming.
These bold predictions from experts and analysts highlight the growing interest in Bitcoin and suggest strong upside potential.
$630 Million in Short Positions at Risk
Despite the growing bullish outlook, over the past 24 hours, traders have built significant short positions worth $629.62 million at the $120,545 level, according to on-chain analytics firm Coinglass. This indicates that many traders strongly believe Bitcoin’s price won’t cross this level anytime soon.
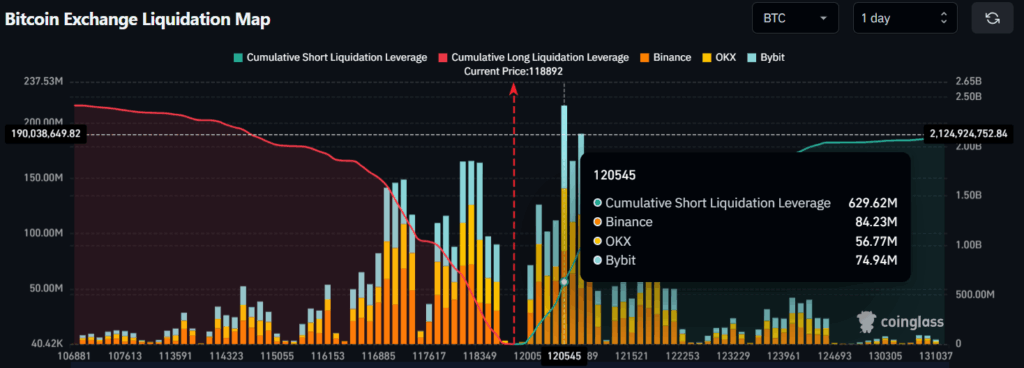
However, if the current momentum continues and the price breaks above $120,545, these notable short positions could be liquidated—potentially opening the path for continued upside momentum.