Zerebro
 Bitcoin
 Quantus
 Pearl
Pearl Starknet
 ZKsync
 NEAR Protocol
MicroStrategy’s stock (MSTR) is showing a newly developed head and shoulders formation on the stock chart. This technical structure would indeed indicate that a drop may occur. Analyst Ali Martinez predicts this drop to hit $300. The pattern is usually considered a bearish indicator. This may mean that the stock is about to experience a sharp drawdown.
The chart indicates that the price hit higher prices before reversing back. The falling price following the right shoulder reaffirms the bearish formation.
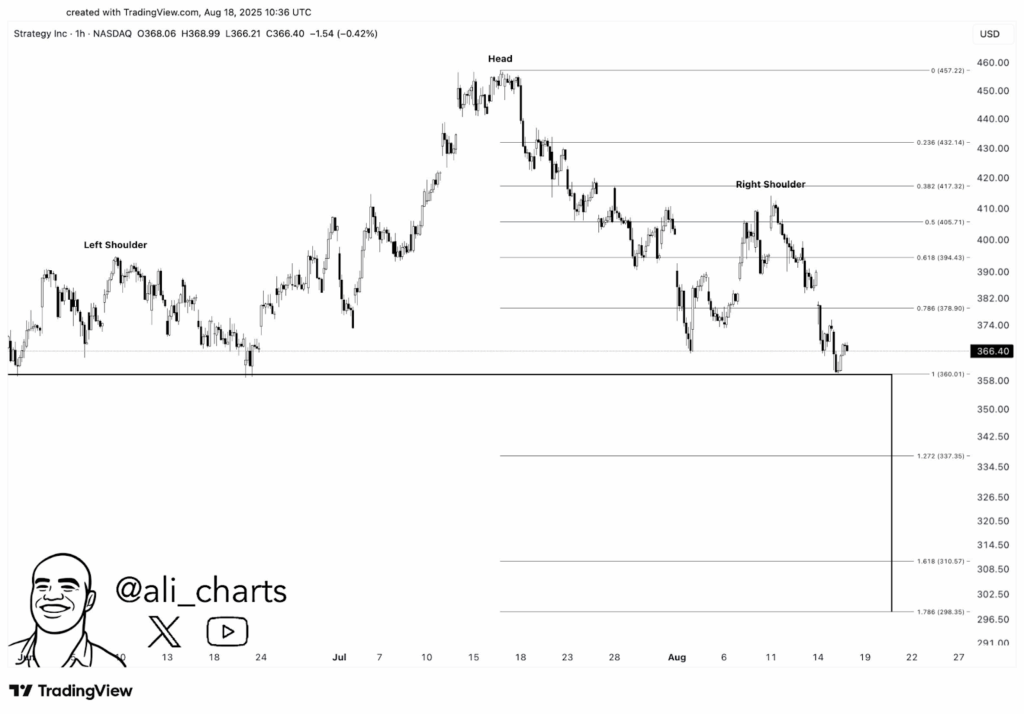
1-hour MSTR Chart | Source: X
Based on the chart data, when the trend started to emerge, the MSTR price at $366.40. This zone coincides with a significant support section in the chart. The zone was previously tested at the end of July. It has key Fibonacci levels, including 0.786 ($378.90) retracement and 0.618 ($394.43).
The next important support level seems to be around $360 if the price falls below this level.
MSTR Stock Prices Taking a Dive
Based on Google Finance data, the stock price has recently fallen to $363.60, a 0.74% drop over the last 24 hours. The chart also reflects the current bearish.
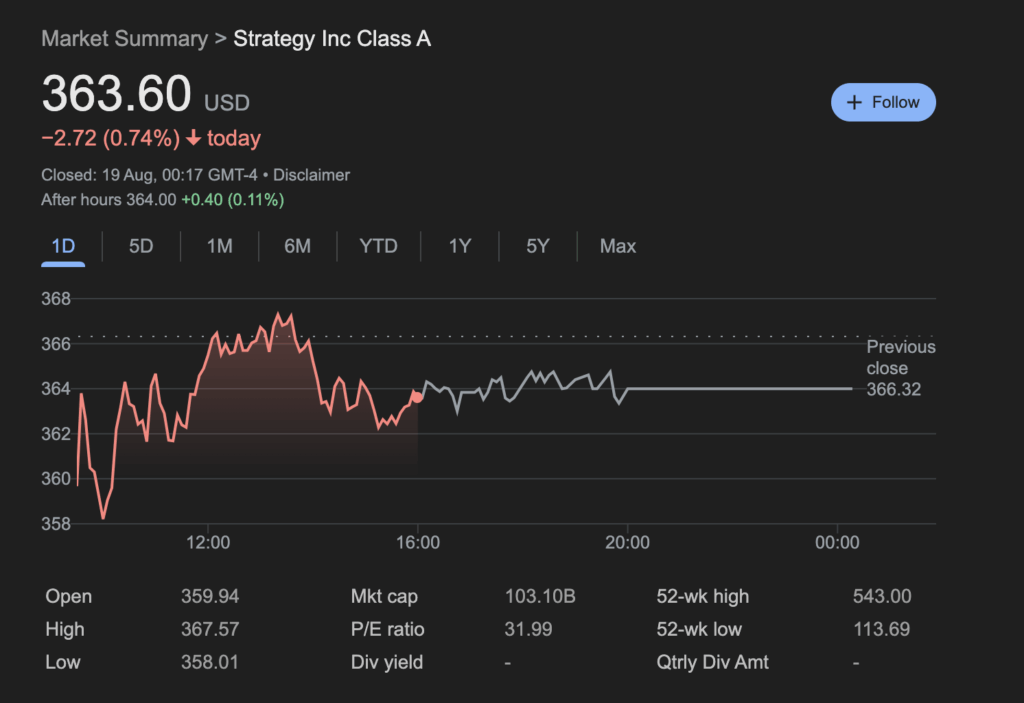
The bearish pressure on Strategy Inc. seems to be gathering strength. This should place the stock in position for further declines as the head and shoulders structure is completely forming.
MicroStrategy’s MSTR STOCK Taking Blows
In the bearish mood, recently, Vanguard, one of the biggest institutional investors in MSTR, trimmed its holding by 10 % in Q2 2025. This step is taken against declining stock volatility as it has been in a narrow range over the last several months.
The support level, $360, has already been tested a number of times in the last four months. A breakdown below the level may indicate sentiment change, leading to the lower move to $300.
Heaping more pressure on the stock’s performance, its recent move to walk back on its earlier promise of dilution has led to further unrest among the investors.
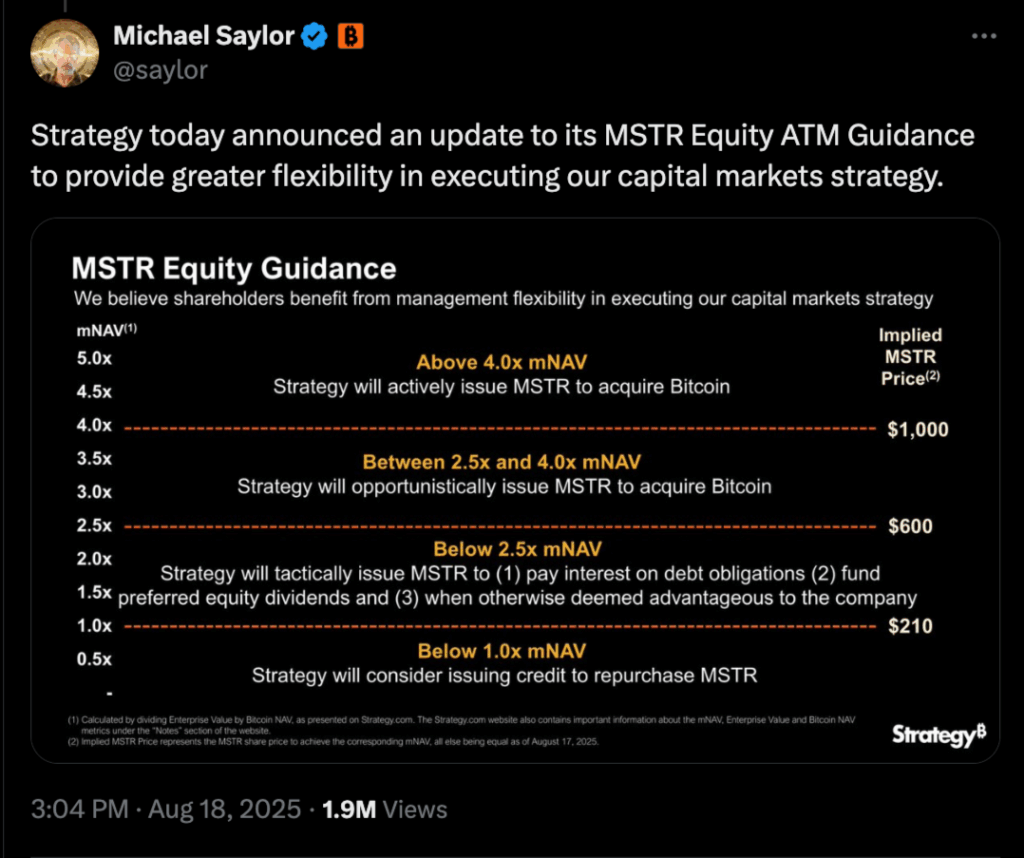
The change of strategy by founder Michael Saylor has enabled the company to dilute below the 2.5x mNAV (market-adjusted net asset value), a move which some analysts believe is likely to signal future shareholder value. Saylor’s comment that they could use capital market strategies without limitations has raised concerns among people who previously held the company’s acquisitions of non-dilutive benefits.
The size of Bitcoin purchases by the company also keeps increasing, with MicroStrategy currently possessing a staggering $73 billion in Bitcoin.

Nevertheless, the company’s financial prospects can be complicated by its strategy relying on price volatility and dilution of Bitcoin and using such strategy as the driver of its development. If the Bitcoin price is going down again, it may impact the MSTR price. This also adds to the overall bearish demand.
The technical configuration of the rate on the chart of Strategy Inc., as well as the recent dilution decision and institutional movements, indicates the risk of problems in the company shortly.
Although the ownership of Bitcoin amounts to certain cushioning effect on the company, the sustained dilution and the overall anemia in the performance of the stock might further lower its value.