Walrus
 Quantus
 Pudgy Penguins
 Bitway
 Quant
Quant Sui
Sui Bitcoin

Key Insights:
- Bitcoin price faces pressure after a weekly MACD death cross warns of downside.
- In case the selling pressure persists, the sell side has warned of resistance at $106K – $100K as a sell trigger.
- Some signals suggest Bitcoin may be nearing a short-term bottom and rebound.
Bitcoin price is facing intense pressure as it traded above the $110,000 support. The market speculated on whether this level will stand or there will be further drops toward $106,000. Analysts were split, as some indicated bearish continuation and others hinted at a rebound.
Bitcoin Price Weakened as MACD Death Cross Appeared
Analyst Ali highlighted a major risk after Bitcoin price formed a death cross on the weekly MACD. Such a technical indicator has indicated sudden drops and suggested increased risks of downside. Historic crosses have been followed by significant drawdowns of 17-27%.
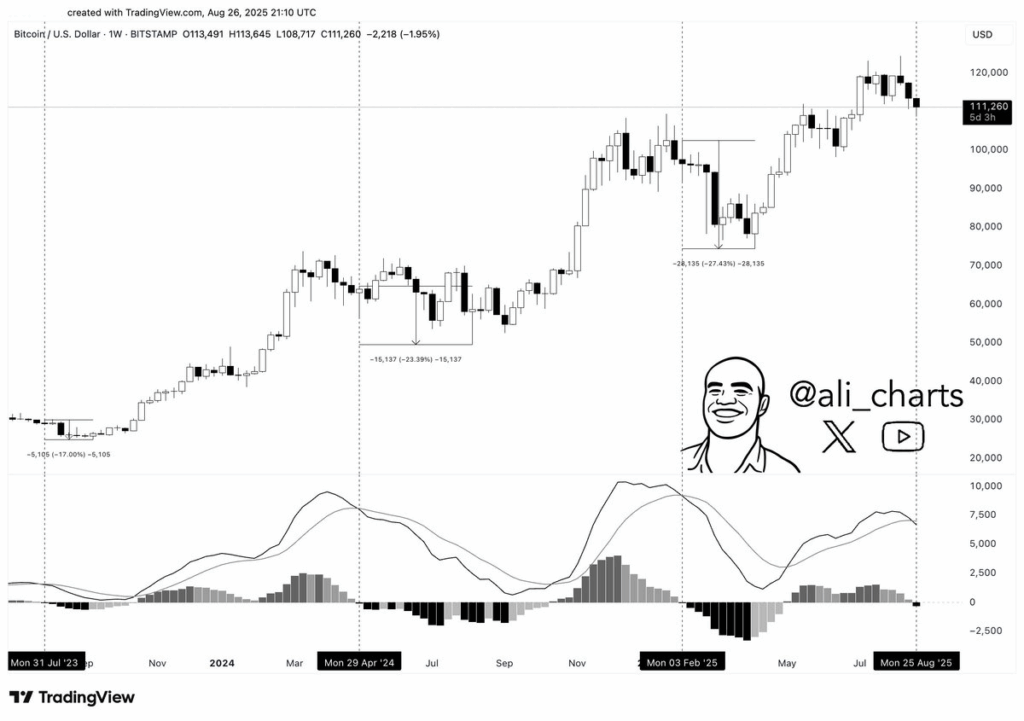
Bitcoin price traded around $111,000 after falling from resistance near $118,000. The MACD cross coincided with weak momentum, and it corroborated previous trend changeovers.
Suppose the selling pressure continues, the market might again test lower support levels. This move might also resemble previous corrections. Thus, it reinforced a cautious outlook among traders and investors.
Furthermore, Ali also emphasized that Bitcoin price has slipped below its established trading channel. That structural failure indicates further weaknesses and provides downside targets of $106,000 and $100,000.
The analyst’s chart presented a position of recurrent failures at the level of $124,000, only to continue lowering under the support of $112,000.
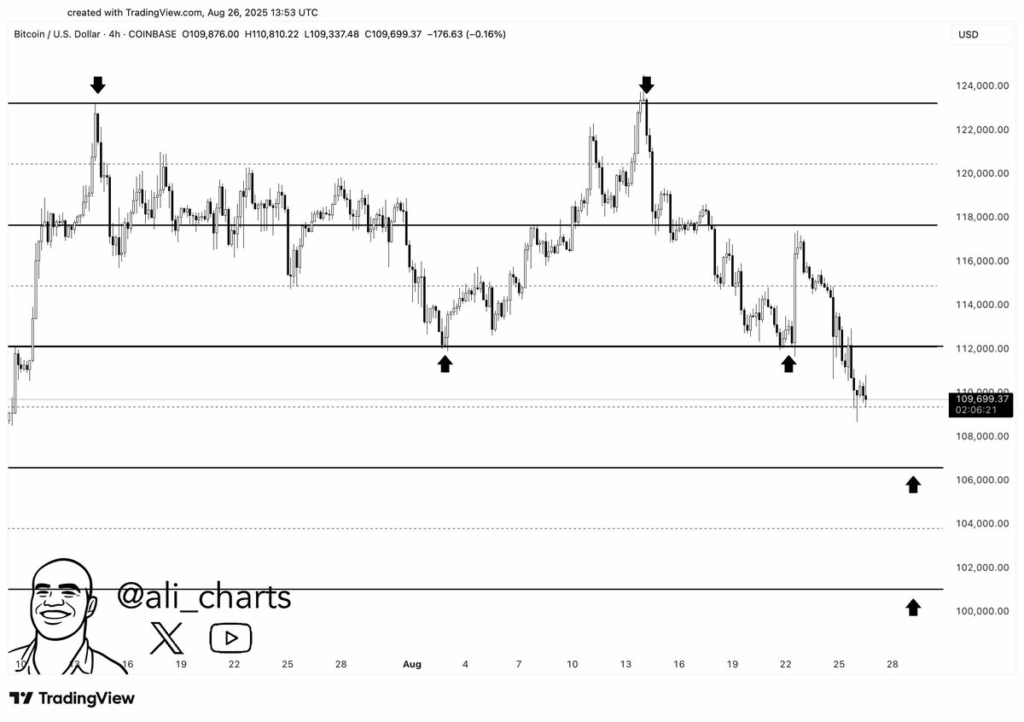
The breakout of the channel reversed the short-term basis in favor and brought high volatility. Unless buyers recover in the near term, market structure now looks bearish.
Traders view $106,000 as the next key level. Intense selling would indicate a more violent drop just below $100,000. Therefore, this area could represent firm resistance.
Rebound Attempts from Demand Zone
Another analyst noted that Bitcoin price rebounded from the horizontal demand zone near $108,000. The chart pointed to the failure to recover, as the Ichimoku cloud blocked the advancement. It would act as the resistance above the $112,500 price level.
Before any bullish trend can build any sort of sustainable trend, a confirmed breakout must be made through this barrier
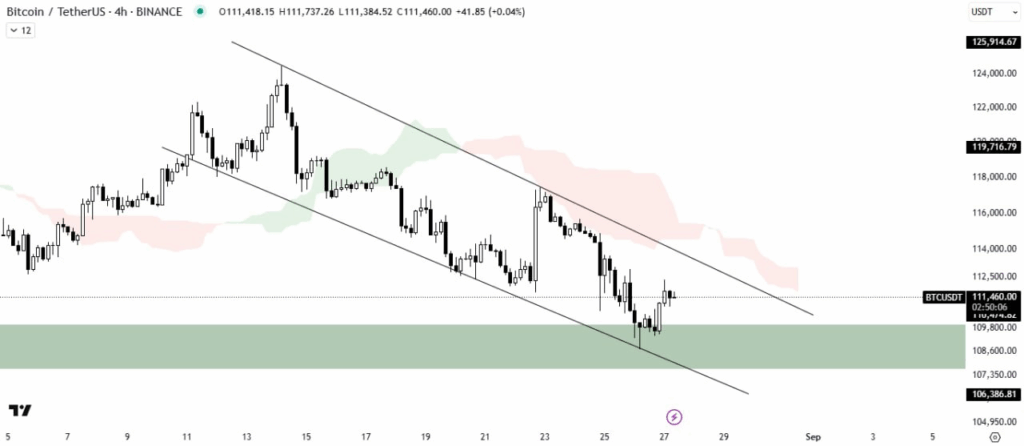
The descending channel continues to dominate, although Bitcoin price has shown signs of stabilization.
If the price breaks out toward the upside of the channel and rises above the Ichimoku cloud, then recovery momentum can be established. As long as that does not happen, the rebound may remain weak and susceptible to further selling.
Daily Candle Suggests Reversal Setup
According to CRYPTOWZRD, Bitcoin price recently closed with a bullish daily candle at $111,285. It may signify the beginning of a turnaround if another bullish candle follows. However, the expert cautioned that a bearish move below $110,500 would nullify the signal and start more declines.
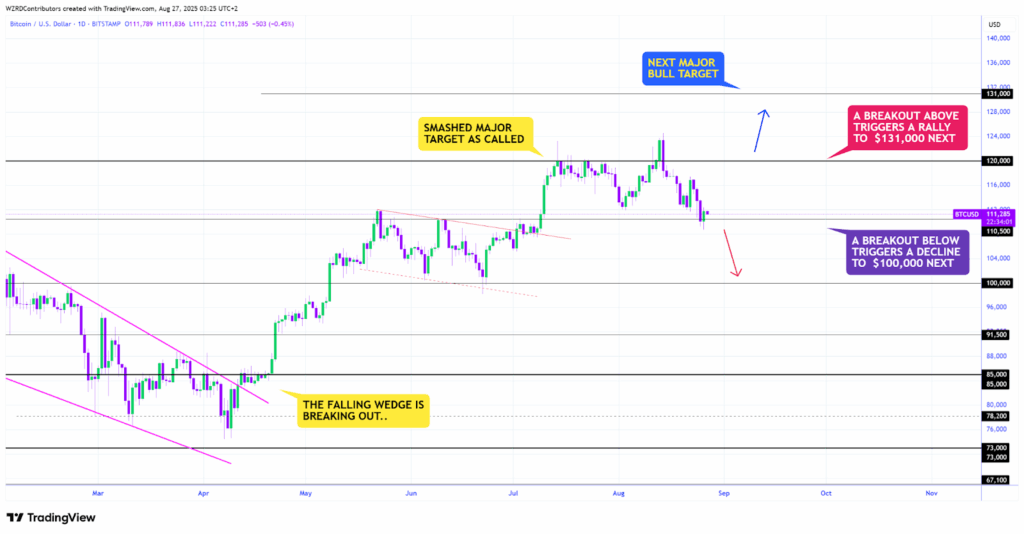
The outlook highlighted two possible paths. Continued closes above $114,800 may break out further, aiming higher, at a price of $131,000. In contrast, a down-move below $110,500 could take the price back towards $100,000.
Signs of a Local Bottom Emerge
BitBull painted a different picture, implying Bitcoin price was possibly at the bottom. The analyst cited that Coinbase Bitcoin Premium turned positive during the selling, indicating institutional demand. Large liquidation clusters are also related to market-bottoming scenarios.
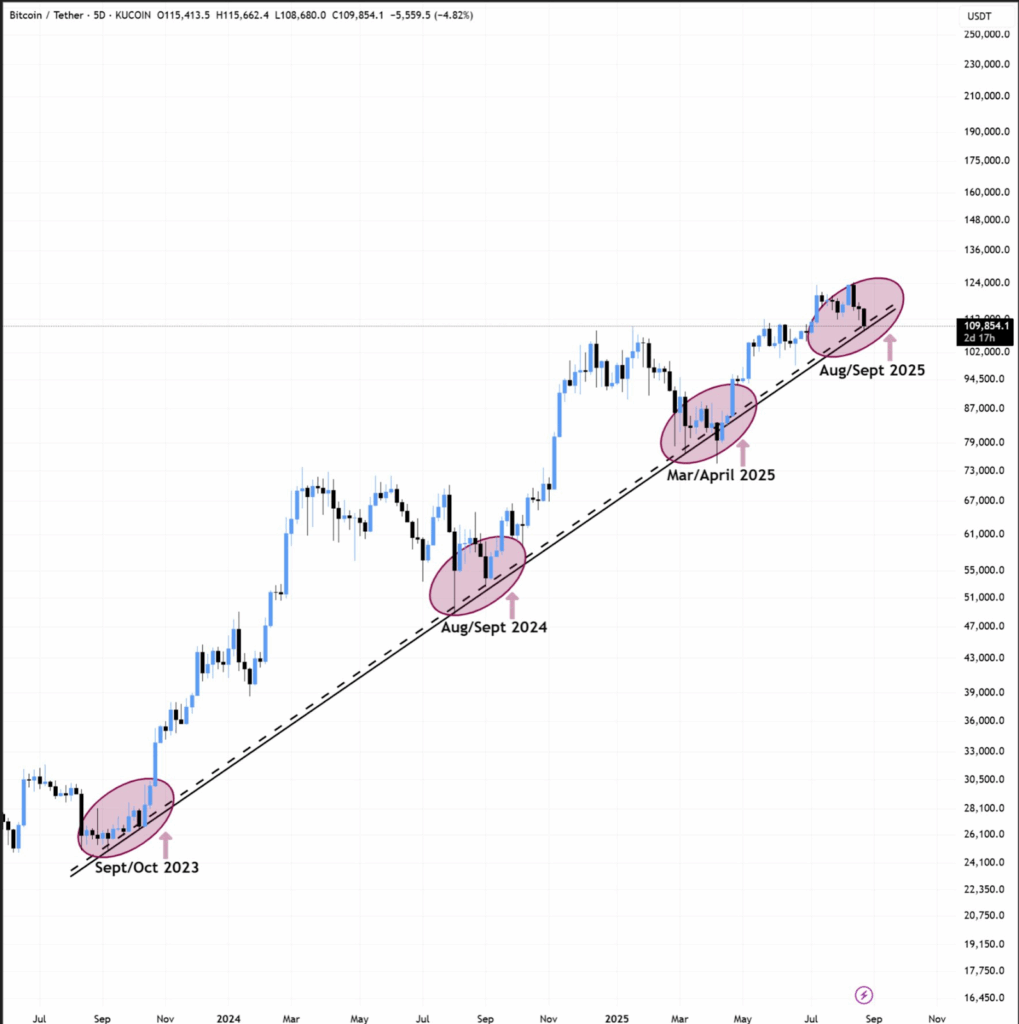
Historical patterns back this view. Liquidations marking the bottoms in August 2024 and April 2025 were subsequently accompanied by rallies. BitBull expected a similar trend to take place, as Bitcoin price is likely to reach around $106,000-108,000 once again before rising towards the upside.
Disclaimer
This article is for informational purposes only and provides no financial, investment, or other advice. The author or any people mentioned in this article are not responsible for any financial loss that may occur from investing in or trading. Please do your research before making any financial decisions.