
 Bitcoin
 Pearl
Pearl Quantus
 NEAR Protocol
 Ondo
Ondo Walrus
 Pudgy Penguins

Key Insights:
- Robinhood stock price has plunged in the past few weeks.
- The company missed the highly anticipated S&P 500 inclusion.
- Technicals point to more downside before an eventual rebound.
The Robinhood stock price has plunged in the third consecutive week and has moved into a correction after falling by12.8% from its highest point this year. This article explores whether HOOD stock could be at risk of a downward spiral after missing the S&P 500 Index inclusion.
Robinhood Stock Price Falls After Missing the S&P 500 Inclusion
The HOOD stock price plunged by over 5.4% after the company missed the highly coveted inclusion in the S&P 500 Index, which would have replaced Walgreens Boots Alliance.
Before the reshuffle, most analysts had been expecting it due to the company’s strong performance over the past few years and its status as a highly valued company worth over $91 billion.
It is also one of the most disruptive forces in the financial industry, as evidenced by its recent announcements. It was the first company to offer commission-free trades and to gamify the trading industry.
Robinhood has also beaten its rivals in starting 24-hour trading in the United States. Most recently, it launched tokenized stocks in Europe and is now working on its layer-2 blockchain network using Arbitrum’s platform.
Instead, Dow Jones, which controls the S&P 500 Index, selected Interactive Brokers as the new company. Interactive Brokers is worth over $105 billion and a worthy entrant into the index.
In most cases, stocks normally jump immediately after the S&P 500 inclusion. That’s because exchange-traded funds and mutual funds that track the index are required to buy it, leading to increased demand.
Robinhood is Growing, But Valuation Risk Remains
While missing the S&P 500 Index is a big disappointment, internal data shows that the company will likely recover over time.
The most recent results showed that the company’s business was experiencing robust growth. Its funded accounts jumped to over 26.5 million, up from 24.2 million in the same period last year.
Most importantly, customers continued to enrol in its gold subscription business, which provides regular and predictable revenue. Its gold subscribers jumped to 3.48 million in the last quarter.
Customer deposits have continued soaring this year, from $221 billion in Q1 to $279 billion in Q2. This is important as it allows the company to generate substantial interest income, especially now that the Federal Reserve has maintained rates above 4%.
Robinhood has also become a major player in the booming crypto industry. Customers prefer its platform because it allows them to trade stocks, crypto, and options in a unified interface.
Wall Street analysts anticipate that Robinhood’s growth has more room to grow. The average annual revenue growth is 37%, reaching $4 billion. It will then get to $4.77 billion next year.
The main risk that may hit the HOOD stock price surge is that it is highly overvalued. It has a forward price-to-earnings ratio of 64, much higher than other faster-growing companies like NVIDIA. Coinbase has a forward multiple of 38, while Interactive Brokers has 30.
HOOD Stock Price Technical Analysis
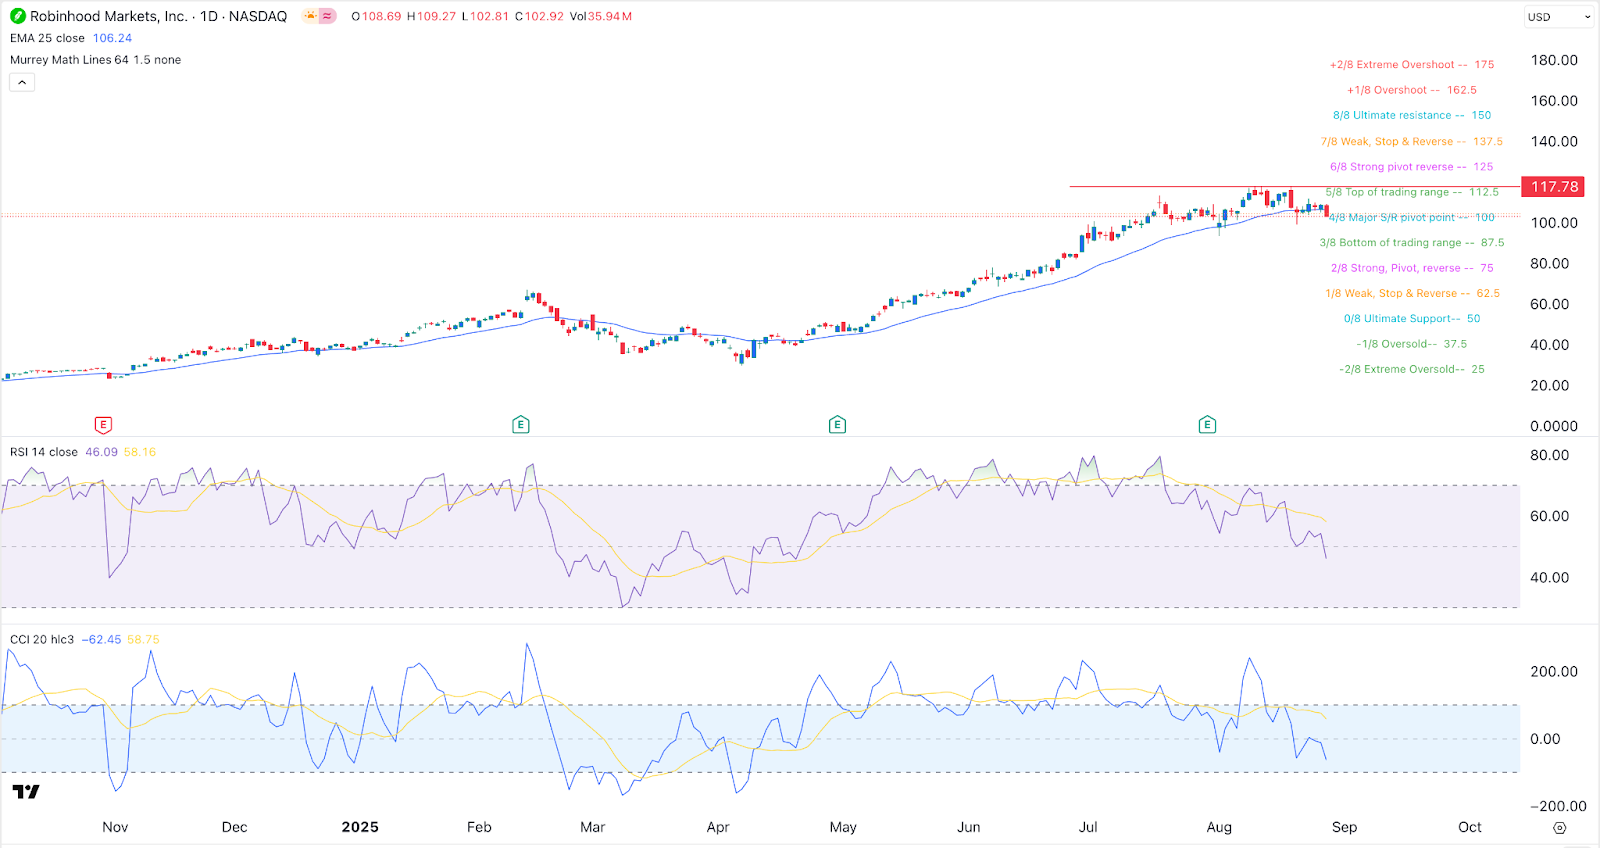
The daily timeframe chart shows that the HOOD share price has crashed after hitting the all-time high of $117. It has formed what looks like a head-and-shoulders pattern and moved below the 25-day moving average.
The stock’s top oscillators, like the Relative Strength Index (RSI) and the Commodity Channel Index, have all pointed downwards.
Therefore, the most likely scenario is where the stock plunges to $75, the strong pivot, reverse of the Murrey Math Lines, and then resumes the uptrend. A drop below that level could see it fall to the ultimate support at $50.
On the other hand, a move above the all-time high at $117 will point to more gains, potentially to the ultimate resistance at $150.
To sum it up, the lack of S&P 500 Index is a big blow for HOOD stock, but it will ultimately overcome it. Additionally, although the stock may have more downside, technical indicators suggest an eventual rebound.



