
 Walrus
 Quantus
 Pudgy Penguins
 Bitway
 Quant
Quant Sui
Sui Bitcoin

Altcoins are re-entering deep accumulation levels reminiscent of the 2020 market cycle. Arbitrum (ARB) is starting to stabilize at the $0.30 support level.
Analysts say this level is similar to the form of higher-timeframe support. The support initiated multi-month recoveries within the Ethereum ecosystem over the last few cycles.
Michael van de Poppe emphasizes that numerous altcoins were on the verge of capitulating in 2022. He states that afterwards, liquidity was restored to the market.
The post had parallels between that stage of mass pessimism and the present construction in Arbitrum. This indicates that this range still maintains massive purchases for ARB and altcoins.
Arbitrum Price Structure Defending the $0.30 Demand Zone as Altcoin Season Approaches
Arbitrum had established a significant demand zone at levels of 0.28-0.32. This region has been repeatedly tested since June.
Charts reveal that the accumulation of the range is substantial, with a significant increase in trading volume. This suggests that once again, there is a buy-side activity.
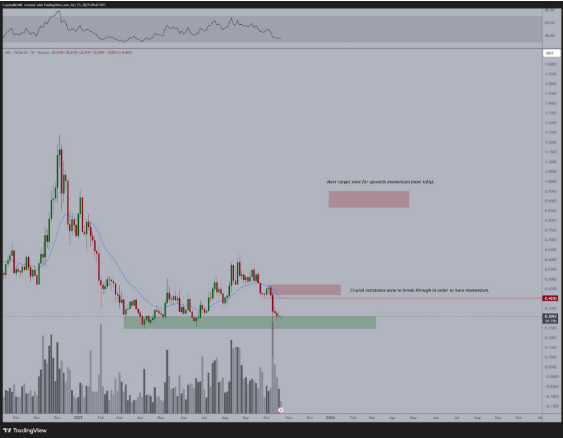
ARB has historical price data that shows it last traded at or around this value in April. It then experienced a short-term recovery, reaching nearly $0.46 in July.
A high-volume hold would be an indication of the beginning of a re-accumulation phase. The move would replicate one seen in mid-2020 across the key altcoins.
The Relative Strength Index (RSI) is indicating a tendency to be close to the overbought zone. The position could mean that the momentum towards the downside is decreasing.
Arbitrum Price Facing $0.40 Resistance
One of the most critical aspects of the analyst’s commentary is the significance of the resistance level at 0.40. Both graphs indicate this as the important pivot point.
The zone has seen previous rebounds fail to set higher highs. Technically, this level is in line with the falling trend that. The trend has been present since August, the upper limit of the general downward trend.
The daily chart suggests that a clean breakout over this structure will be necessary to signal a reversal of the trend. A value above 0.40 would change the market attitude from distribution to accumulation. This would open the way to a possible revisit of the 0.90 to 1.00 target area.
This type of recovery has been historically structured in the same way. In late 2020, alternatives to Bitcoin, such as Polygon (MATIC) and Avalanche (AVAX), experienced long consolidations in narrow ranges. They then exploded upward when the resistance areas were cleared.
Arbitrum Price Moving Within a Triangle Formation as Altcoin Index Grows
More charts show a downward triangle formation. The highs are lower, and the support is flat at around $0.30. These patterns will lead to a breakout when momentum converges.
The stochastic oscillator demonstrates a slight increase in the oversold levels. The increase means there is a possibility of immediate relief.
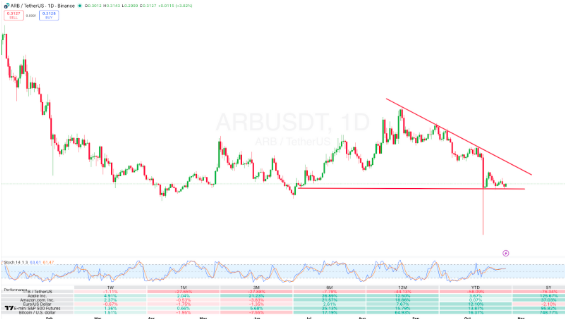
To confirm the existence of bullish strength, daily closes above the trendline and level of resistance at $0.40 must be provided. On the negative side, inability to hold the $0.28-0.30 region may expose risk to the former wick of the day at about 0.25.
This would be similar to what it did in early October. However, by the most recent session, ARB has gained slightly, with its price now at $0.31. The price movement represents a 3.8% intraday improvement.
This structure implies that there is still no substantial upside in the short term. However, the momentum can be changing as the altcoin season index also hits 26.



