
 astronaut
 Zylo Ecosystem
 Pearl
Pearl Quantus
 Bitcoin
 Sui
Sui Bitway

The Gold price kept its two-month important rising trendline support in the week. This indicates strength after a sharp fall from the October highs.
Recent analyst data indicate that the metal has a 2-month trendline, which appears solid. Gold rebounded on the 2-hour chart, according to Investing.com. The bounce occurred near a key support zone around the 4,000 level.
This is where the buyers intervened violently when the line was breached by a temporary drop. The rising trend has remained strong since early August. It is characterized by successive high and low points, with a distinct upward trend.
This trendline, initially created in mid-August at around the $3,400 level, has served as a strong dynamic support. It provided support in several retests in September and early October.
The most recent movement has seen the gold price fluctuate between the $4,050 and $4,100 areas. After that, it returns to its previous level. This zone has been observed to coincide with previous demand sweet spots and Fibonacci retracement levels.
This makes this zone more important to short-term movements. Breaking above the confirmed rebound of $4,200 would indicate a newfound bullish movement. The move could also lead to an extended rally, potentially reaching the $4,350-$4,450 range, if momentum persists.
Historical Trendline Resilience Points to Underlying Strength in Gold Price
Gold prices rose in Q3 due to strong technical momentum. Macroeconomic uncertainty also contributed to the bullish trend.
Since the middle of August, the price action has shown a steady rise to under $3,300. Recently, it reached approximately $4,380, representing a nearly 30% rise in less than three months.
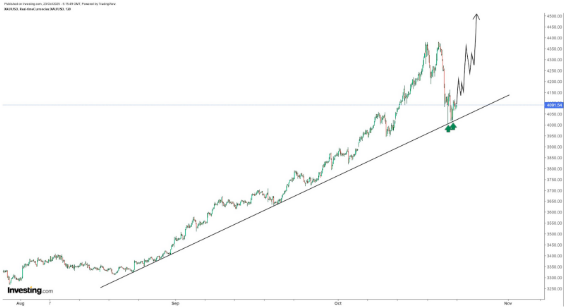
Every corner of this uptrend has been greeted by heavy trading along the upward trend line. This indicates accumulations by the institutional investors or funds.
In the analyst’s chart, there are two green arrows indicating an exact bounce on the diagonal support. This trend is similar to the previous stages in late August and mid-September.
During the phases, there were similar retests were followed by new multi-week rallies. The forecast made on the existing chart presents a possible sharp decline back to the level of $4,45.
Long-Term Gold Price Chart Shows Rejection at Fibonacci Resistance
Analyst EtherNasyonal shared a three-month macro chart. It shows gold testing the top of a long-term rising wedge. This complements the short-term bullish setup.
The chart shows that the gold price hit the level of the 0.618 Fibonacci extension. This is a figure based on the previous multi-decade cycles. From the cycles, we see rejection at around $4,381.
According to analysts, this is where the gold price met the upper trendline of the wedge and the golden-ratio resistance. The past shows that corrective phases have followed those confluences in the past.
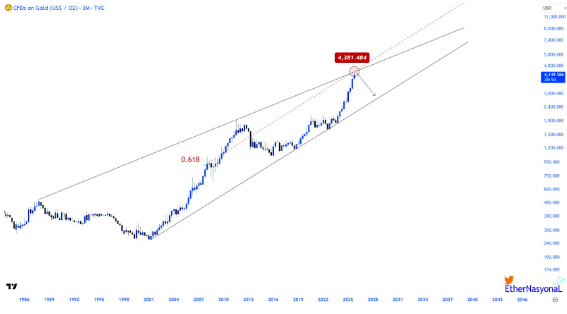
This was the last long-cycle peaks of 2011 and 2020. This rejection of around 4, 381 is in line with this historical trend. This means that the long-term progress of gold might be entering a period of consolidation.
The current formation remains structurally bullish. This holds as long as the price stays above $3,500 at the lower wedge boundary.




