
 Bitcoin
 Solana
 Pearl
Pearl Zerebro
 Aerodrome Finance
 LayerZero
 NEAR Protocol

The Bitcoin price traded near $109,500 on Oct. 31, recovering modestly from the week’s earlier losses as traders focused on a major resistance cluster around $112,000. On-chain and derivatives data suggested a volatile move ahead, with billions in short positions at risk of liquidation if bulls regained momentum.
Ali Charts, citing Glassnode data, identified $112,340 as the next critical on-chain resistance level for Bitcoin. “Right now, the most important resistance level ahead of Bitcoin is $112,340,” the analyst wrote on X, referring to the UTXO Realized Price Distribution (URPD). The metric indicates a significant concentration of realized prices around that level, a zone where many holders previously purchased BTC.
$112K Marks the Line Between Relief and Rejection
According to Whale Insider, over $3 billion in short positions would be liquidated if Bitcoin broke above $112,600. Such an event could trigger a sharp short squeeze, pushing prices higher as traders rush to close positions.
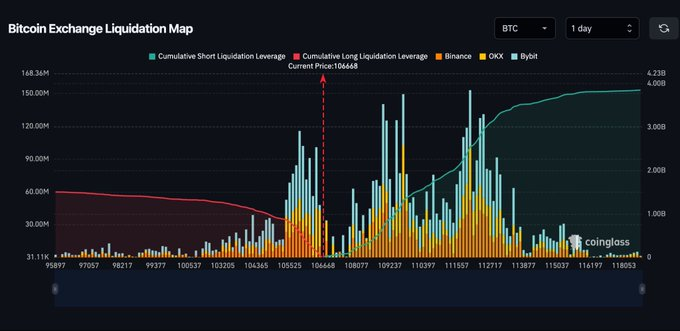
At press time, Bitcoin hovered at $109,511, up 1.1% over the last 24 hours, according to TradingView. The daily chart showed the coin bouncing between Fibonacci retracement levels, with $103,500 acting as the lower boundary and $112,600 serving as the key breakout threshold.
The Stochastic RSI remained near the midline, suggesting consolidation before the next move. A decisive daily close above the 0.382 Fib level ($111,000) would strengthen bullish momentum, while a rejection could send the price back toward $105,000 support.
ETF Outflows Deepen Selling Pressure
Despite the technical rebound, selling pressure persisted in institutional markets. Coin Bureau reported that clients from major spot Bitcoin exchange-traded funds (ETFs), including BlackRock, Fidelity, Bitwise, ARK 21Shares, Invesco, VanEck, and Grayscale, collectively offloaded $490.43 million in BTC holdings.

These ETF outflows, led by BlackRock with $2.6 billion, coincided with fresh retail selling activity on Binance. Data shared by Binance analysts indicated that over 9,200 BTC, worth roughly $1 billion, were sold by retail traders on Oct. 30 alone. A previous wave on Oct. 22 saw more than 12,000 BTC sold near the $108,000 zone.
Such synchronized selling across ETFs and exchanges has historically aligned with local bottoms. As Binance’s report noted, retail investors tend to sell into fear cycles, while long-term holders accumulate.
Whales and Retail Diverge Again
The current setup mirrors similar accumulation patterns from past corrections. Long-term Bitcoin addresses continued accumulating near the $107,000–$108,000 range, while short-term traders exited positions amid volatility.
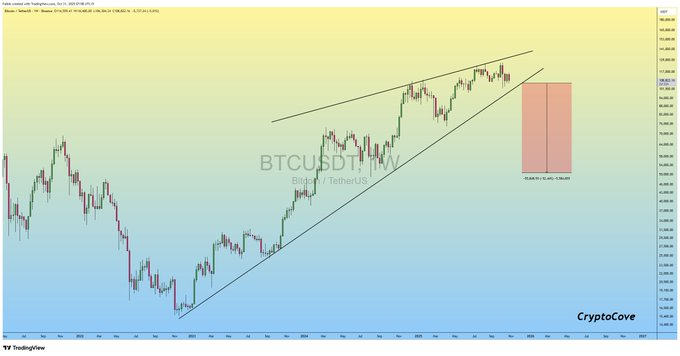
Captain Faibik, another X analyst, warned that a rising wedge formation on the weekly chart indicated bearish mid-term risk. “Bitcoin is still moving inside the wedge, but a breakdown looks imminent,” he wrote, adding that weekly RSI was showing early weakness.
However, on-chain indicators tell a more balanced story. The URPD chart shows limited realized volume above $112,000, suggesting that a clean break could pave the way for $120,000 before major supply zones reappear.
Bitcoin Price Technicals Suggest Tension Near the 50-Week SMA
TedPillows highlighted that Bitcoin hadn’t closed a weekly candle below its 50-week SMA since Q1 2023. That moving average, currently around $107,000, remains a key line for maintaining the broader uptrend. “This is the level Bitcoin needs to hold for this bull run to continue,” Ted added.
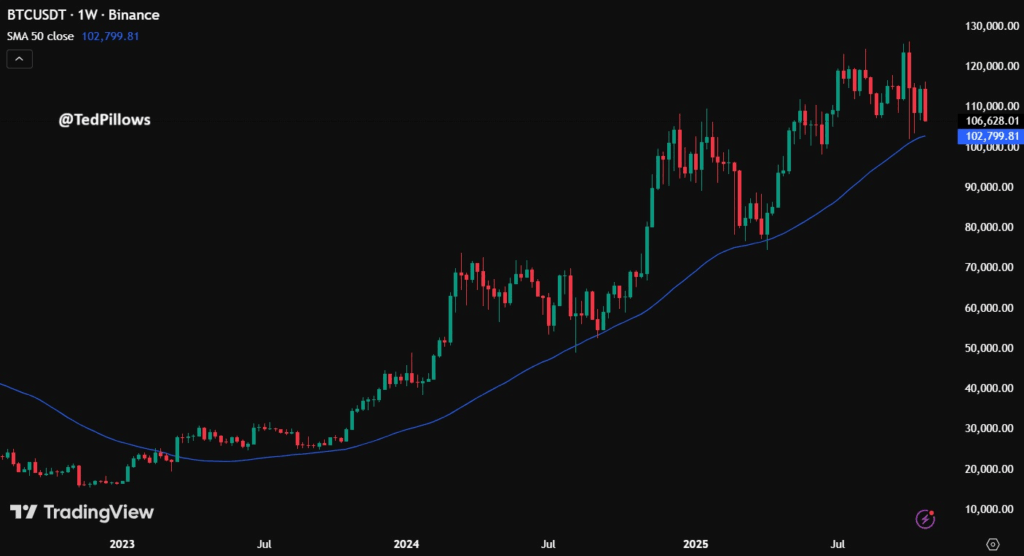
The area around $107,000 has repeatedly absorbed sell-offs this month, indicating resilient demand. As of Oct. 31, Bitcoin’s price structure remains range-bound between $103,500 and $112,600, forming what analysts describe as a high-volatility compression zone.
Short-term volatility could spike if ETF flows stabilize and shorts begin to unwind. A clean breakout above $112,600 could lead to cascading liquidations worth several billion dollars, rapidly pushing prices higher.
Retail Capitulation Often Precedes Local Bottoms
Despite the bearish overhang, some traders see the recent retail capitulation as a healthy reset. The Binance data suggest that retail and ETF investors are currently acting as primary sources of selling pressure. This combination often coincides with short-term bottoms, rather than extended downturns.
Historical parallels from 2022 and early 2023 show that Bitcoin often rebounded sharply after similar liquidation-driven corrections. The URPD data reinforces this dynamic, with most on-chain support now concentrated between $105,000 and $108,000, the same area where long-term wallets have accumulated heavily.
The Road Ahead
Bitcoin’s next direction likely depends on whether bulls can reclaim the $112,000–$113,000 range. A breakout would threaten billions in leveraged shorts and could reignite momentum toward $120,000. Conversely, a rejection may extend the current sideways phase, especially as ETF outflows and retail fear persist.
With the Federal Reserve’s December policy shift looming and liquidity conditions improving, traders are watching whether institutional flows return to support the next Bitcoin leg. For now, the $112,340 resistance identified by Ali Charts and confirmed by URPD data remains the market’s focal point.
If breached, the move could mark the end of October’s consolidation and the start of Bitcoin’s next major wave.



