
 streamoors
 IGNITION
 NEAR Protocol
 Injective
 LayerZero
 Pearl
Pearl Hyperliquid

Stellar Lumens (XLM) could challenge other Layer 1 (L1) tokens in the tokenization of real-world assets (RWA). The altcoin’s blockchain has collaborated with major institutions worldwide, with the price action beginning to align with these developments.
XLM crypto flashed a buy signal on the daily chart, but it seemed unripe for a move higher when deducing the direction bias on the weekly chart.
TD Sequential Flashes Buy Signal on XLM Crypto
The daily price chart of XLM cryptocurrency displayed a buy signal from the TD Sequential indicator when the altcoin’s value was trading at $0.2748. The indicator, which has historically predicted bottoms and tops, suggested that a pop was building. This is only if bulls bought the idea and pumped capital into XLM.
From a numerical perspective, the next problematic area was at the $0.30 region, assuming the signal was correct. Further price appreciation could take XLM crypto toward $0.34 or higher.
Despite this buy signal, XLM crypto defied it by dropping 4% on the day and 9% on a weekly scale. Similarly, daily trading volume declined by about 26%, reaching $203 million.
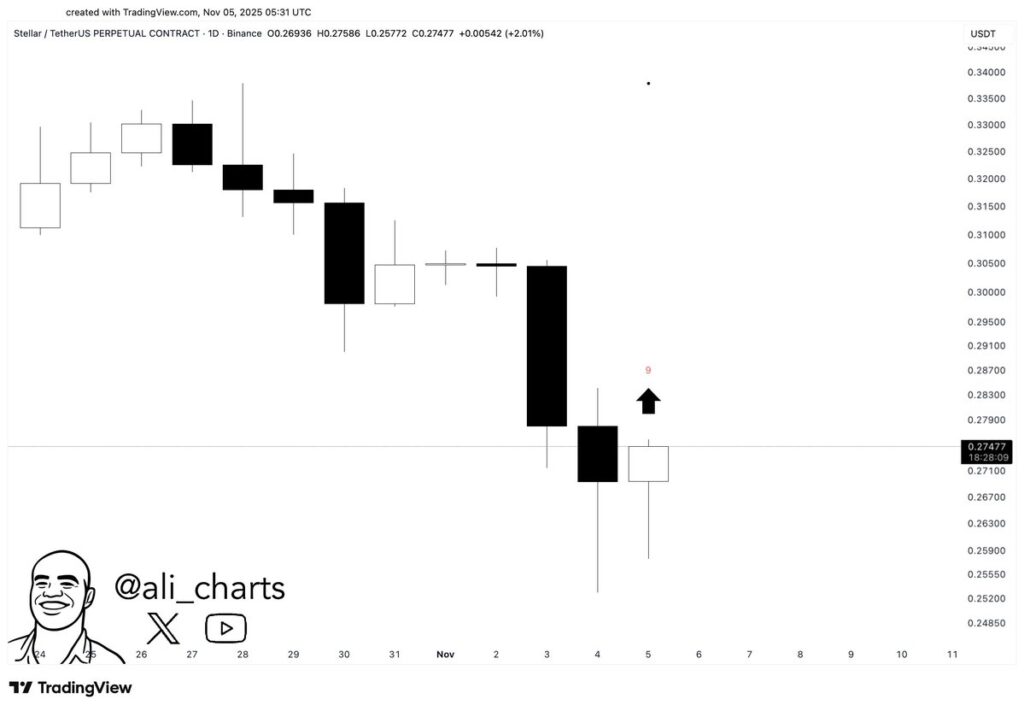
Alternatively, a long-term perspective indicated the $0.20 as the most crucial level. This level held all monthly candles of 2025 above it, suggesting a drop to it could not be overlooked. In fact, reaching this level could spark a genuine price reversal, even across the broader cryptocurrency market.
Analyst Eyes Rally Repetition
Analysts were eyeing a repetition of the rally that began in mid-year and continued through mid-August. XLM crypto was trading in a falling wedge structure on the weekly chart, similar to its position before the previous surge. This pattern is typically a bullish reversal formation, but it requires support from volume and momentum following the breakout.
When writing, the price was on average around $0.27, slightly above the critical price of $0.25. However, the pattern could be completed at its bottom around $0.20. This would more likely trigger the U-turn. Thus, higher prices encourage buyers to work toward the resistance levels at $0.41, $0.50, and $0.60.
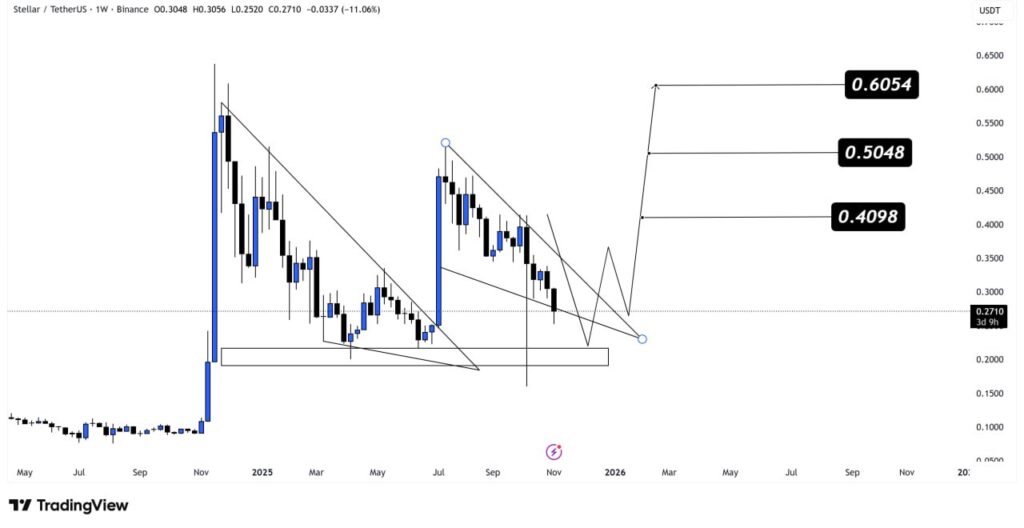
Conversely, non-sustenance of support at $0.20 could nullify the bullish formation. This would open the way toward levels below $0.20, where the historical buying pressure appeared.
This wedge compression indicated accumulation that precedes price rallies in risk-on and risk-off assets. Weekly closes will be essential to determine whether XLM would proceed to consolidate or start a new upward trend.
RWA and DeFi on XLM Crypto Blockchain
Lastly, Messari data showed the strong position of XLM crypto in the RWA sector, with the Total Value Locked (TVL) rising to $475 million. This indicated XLM was excelling in compliance and speeds needed for traditional finance (TradFi).
For instance, Franklin Templeton launched the Franklin OnChain U.S. Government Money Fund (BENJI) in Hong Kong. XLM was the largest holder, controlling $600 million in BENJI. Ethereum (ETH) and Arbitrum One (ARB) followed, with funding of $40 to $60 million.
Other RWA issuers on the XLM crypto blockchain included U.S. Treasuries, equity funds, corporate bonds, institutional funds, real estate, non-U.S. debt, and commodities. The RWA market cap also included DeFi integrations and infrastructure.
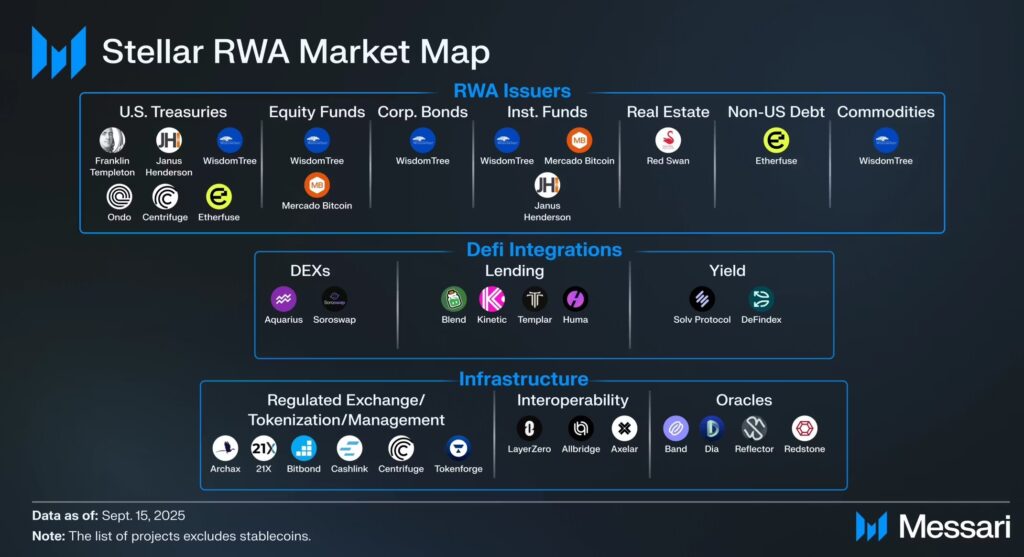
Altogether, the extent of XLM crypto in providing a layer for these services put the altcoin at place of advantage. However, despite the buy signal, chart analysis suggested the time was not ripe to take long trades.




