astronaut
 Walrus
 Pearl
Pearl Bitcoin
 NEAR Protocol
 Zcash
Zcash Hyperliquid
Dogecoin price has been staging a massive intraday recovery and is about to hit a key resistance at $0.18. Analysts point to various positive developments that could help break out of the meme coin above $0.20. Recent on-chain and technical data indicate new purchasing activity and a more favourable market structure.
Dogecoin Price Builds Bull Flag for $0.20 Breakout
Analyst Trader Tardigrade noted that the Dogecoin price has been forming a classic bull flag on the two-hour chart. Following a sharp move higher, the structure suggests a continuation phase if momentum is sustained.
The pattern features two trendlines coming together after a vertical climb, which is a typical pattern of consolidation just before a new leg higher. A breakdown above $0.182 would confirm the flag and place DOGE for a rally to $0.20.
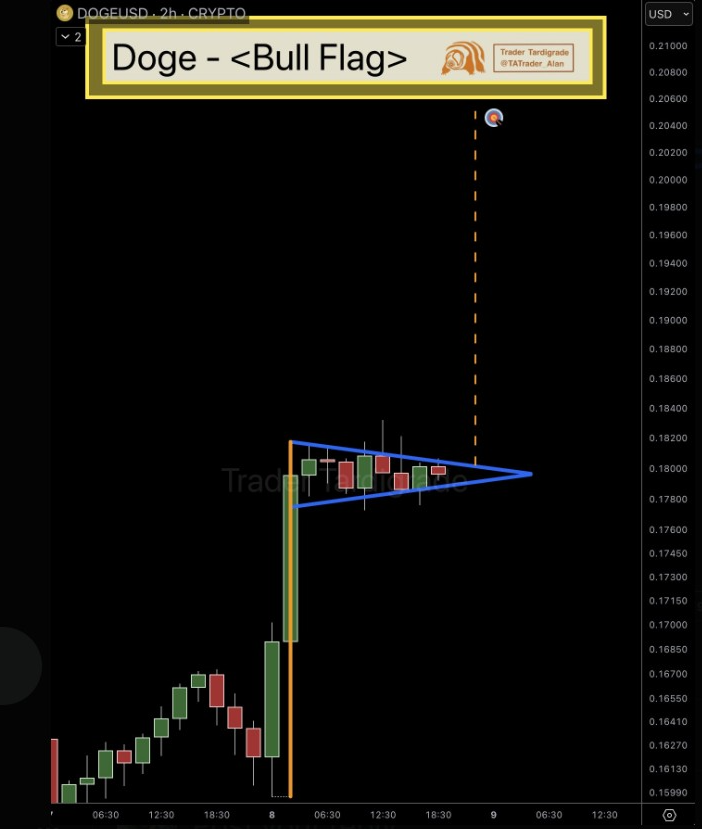
As shown on Tardigrade’s chart, the next resistance zone is close to $0.198 to $0.205. This zone would be cleared out, and a short covering might occur with a fast extension up. However, if there is no breakout, the support level of $0.17 may be retested briefly before a recovery can occur.
Buyers are active in the middle of the $0.17 range, which indicates that sentiment remains strong and constructive. If confirmed, the trend could breathe new life into the retail sector after weeks of flat trading.
Momentum Strengthens as Stochastic Indicator Turns Bullish
In another analysis, Tardigrade examined the two-month stochastic oscillator, which suggests that the Dogecoin price is entering its oversold realm. Historically, such readings have been followed by powerful multi-month rallies that pushed DOGE price to new highs.
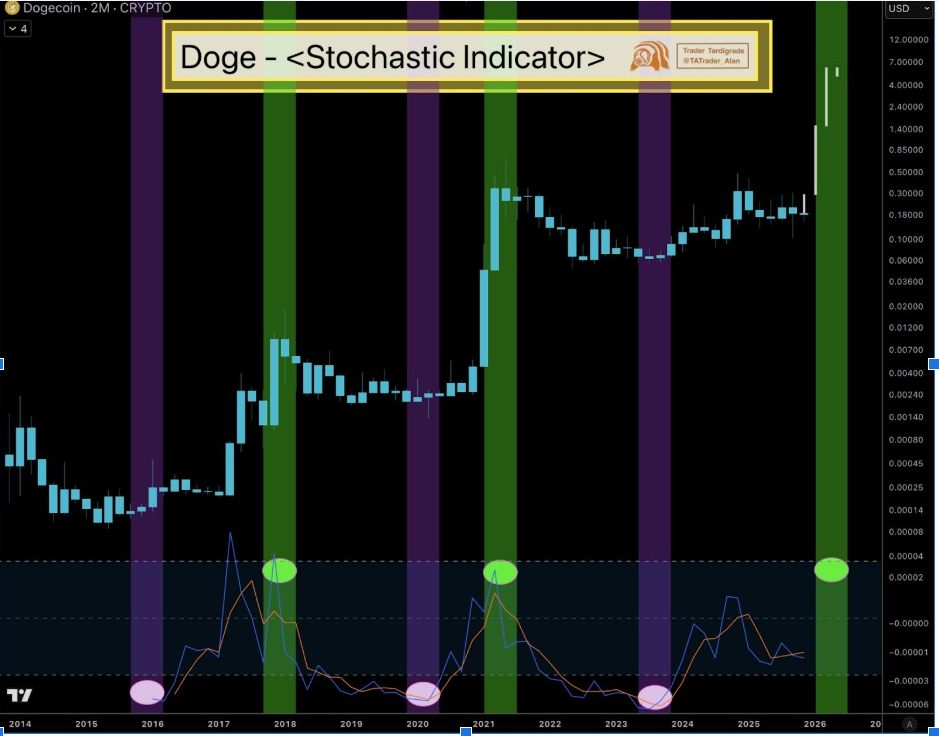
The crossover of the oscillator showed signals similar to those before bull runs in 2017, 2021, and early 2024. All of those gains were multiplicative when the indicator reversed upward from low. Tardigrade suggested that the next upcycle might peak around early 2026 if the same cycle repeats.
This interpretation suggests that DOGE is resetting within a long-term buy position. Investors who have remained must be rewarded for becoming part of the beginning of a wider improvement.
Historical market momentum cycles are typically correlated with better liquidity and retail flows, according to market watchers. The next expansion phase could already be tentatively forming silently in the background.
On-Chain Data Shows Accumulation Near $0.20
Analyst Ali posted a Glassnode chart showing that DOGE had accumulated more than 11.12 billion DOGE, equivalent to approximately $0.20. This range affirms that it is a significant source zone and psychological resistance zone for traders.
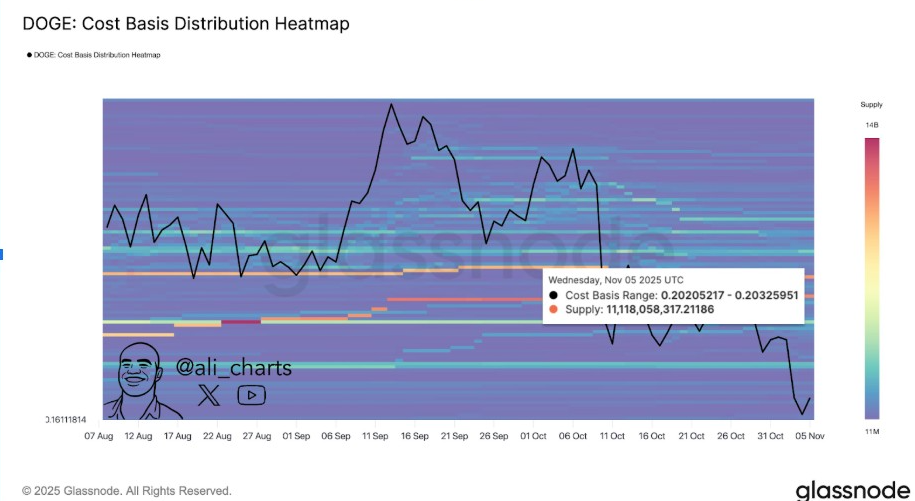
The cost-basis heatmap showed a dense group between the values of $0.202 and $0.203. Ali explained that until the Dogecoin price clears this range, upside momentum may encounter resistance from sellers who want to take a profit and breakeven.
The same holders may become long-term if the DOGE price successfully breaks out above that zone. The rotation tends to convert overhead supply into strong demand, which reinforces the bullish thesis.
On-chain accumulation through these levels indicates renewed interest from large whale wallets. The consistent clustering of cost basis values indicates belief in DOGE’s medium-term path to recovery.
Breakout Above $0.186 Could Confirm Uptrend
BitGuru noted that DOGE price recently broke through a long-term downtrend and formed a consolidation phase at approximately $0.18. On his chart, the zone of $0.186 serves as the pivot point between consolidation and a resumption of the uptrend.
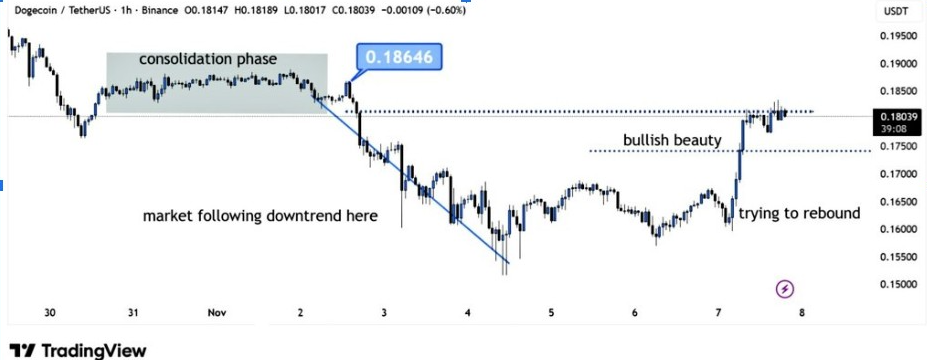
If Dogecoin price flips $0.186 into support, it could signal a complete reversal of the trend. The rebound was preceded by an extended compression phase that absorbed selling pressure, providing a chance for buyers to re-enter the market.
BitGuru’s structural pattern indicates a rising pattern of higher lows forming underneath resistance. The double bottom pattern suggests a more bullish sentiment and a potential move towards $0.20 when momentum is stronger.
The analyst stated that not holding $0.186 would stall the breakout, but this was not a sign of any invalidation of the overall bullish pattern. The market structure remains favourable, indicating that the correction phase is almost over.