
 Bitcoin
 Aerodrome Finance
 Zerebro
 Starknet
 Zama
Zama Pearl
Pearl ZKsync

Bitcoin (BTC) reclaimed the $104,000 mark on Nov. 10 as traders reacted to regulatory progress and renewed optimism across the U.S. crypto market.
Bitcoin Price Reclaims $104K Amid CFTC Breakthrough
Bitcoin price recovered above $104,000 after Commodity Futures Trading Commission (CFTC) Chair Rostin Behnam confirmed that the agency was working on spot Bitcoin trading regulations for U.S. exchanges.

“Another Wall Street barrier broken. This is huge,” wrote The Bitcoin Historian on X, summarizing the growing market sentiment. The announcement reignited optimism after weeks of sideways movement and fueled discussions about institutional entry through regulated platforms.
Data from TradingView showed BTC trading near $106,446, up 1.66% on the day. The move came after bulls defended the key $104,000 support, a level highlighted by trader Ted Pillows as critical for the next leg higher. “A reclaim of this zone will send Bitcoin towards May highs,” he said.
Bitcoin Price Traders Target $108K–$110K Zone
Market participants turned their focus toward the $108,000–$109,000 range, where previous rallies had stalled. Technical analyst Crypto Tony confirmed trimming profits as BTC hit the $106,450 resistance zone, noting, “Flip here and we send higher, possibly to $109,000.”
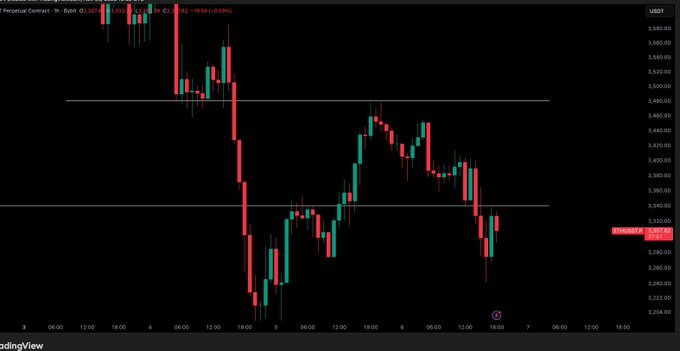
According to Michaël van de Poppe, a break above $110,000 could trigger a move toward Bitcoin’s all-time highs. “The government shutdown is nearly over, which would be an ideal signal for the markets to turn back into bull mode,” he said. Van de Poppe added that if BTC clears $110K, “we’ll likely see a rally towards the ATH,” though he expects altcoins to outperform during that phase.
Price action reflected cautious optimism, with bulls looking to confirm the 50-day moving average as short-term support. The MACD histogram turned positive, signaling a recovery in momentum after a week-long decline.
Weekly Close Above 50-Week MA Fuels Confidence
Analyst CryptosRus observed that Bitcoin’s weekly candle closed above the 50-week moving average, describing it as a “textbook shakeout.” He added, “The bull trend is alive and well. The next move could be parabolic.”
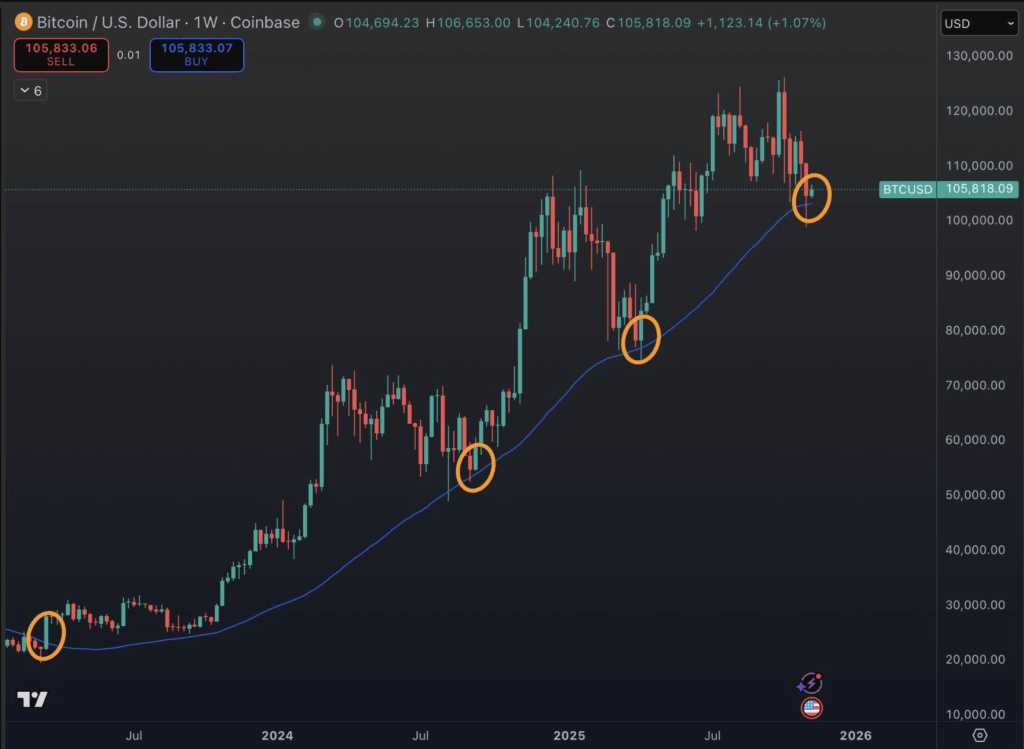
This technical milestone, often viewed as a gauge of long-term strength, aligns with the broader recovery in risk assets following easing fiscal concerns in Washington. Bitcoin’s resilience above the weekly moving average suggests that the $98,000–$104,000 region remains a strong accumulation zone for buyers.
The chart shared by mosescryptomaster on TradingView displayed a Fibonacci retracement range between $98,240 and $126,272, defining short-term boundaries for BTC’s potential swing targets. The latest rebound followed a brief dip below $102,000, where bears failed to sustain downward pressure.
Historical Parallels Emerge as Stimulus Talk Returns
Macro traders also drew parallels between current political developments and Bitcoin’s 2020 stimulus rally. As Crypto Rover recalled, when former President Donald Trump signed the CARES Act in March 2020, “Americans received $1,200 checks. Many poured them straight into crypto.”
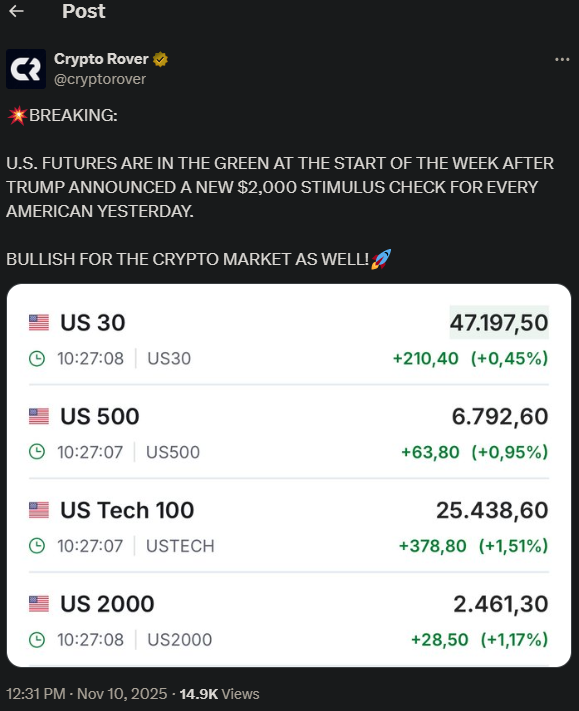
That period saw Bitcoin gain 50% within weeks, with Coinbase and Binance recording surges in $1,200 BTC buys. “Fade the next Trump stimmy at your own risk,” he warned, hinting at renewed expectations of fiscal expansion under Trump’s renewed policy agenda.
Such narratives resonated across social media, where traders speculated that potential fiscal easing could once again favor Bitcoin’s demand. However, analysts stressed that the current macro environment differed sharply from 2020’s liquidity-driven rally.
Bitcoin Price Bulls Eye $126K Fibonacci Target
While traders focus on the $ 110,000 breakout, some forecasts have become more ambitious. DonaldsTrades projected a potential rally toward $139K, arguing that a bearish fakeout could trap short sellers. “Once we get there, everyone will flip bearish, expecting a breakdown. But that’s the trap we break up instead and head toward $183K,” he said.
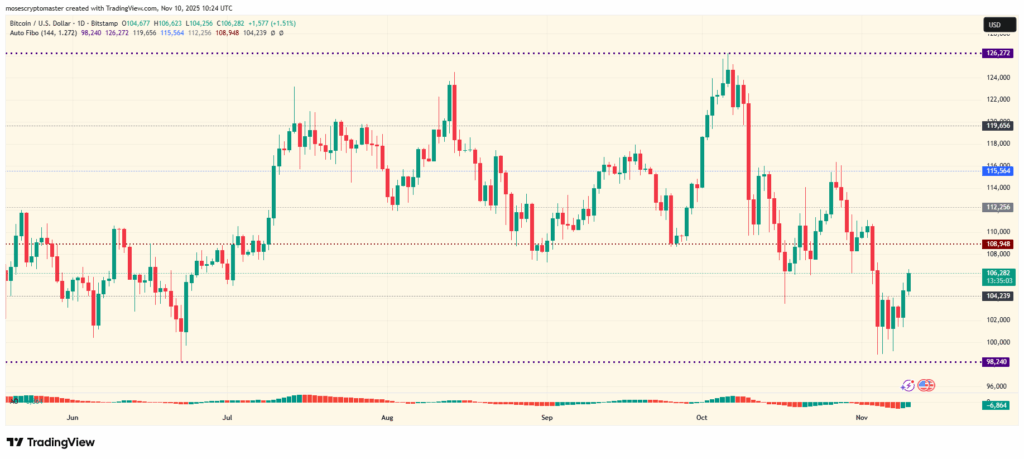
Though the target remains speculative, Bitcoin’s Fibonacci extension around $126,000 represents the next key technical barrier, according to the TradingView chart. A clean close above $110,000 could open the path toward that zone, aligning with historical resistance from mid-2024.
Still, market sentiment remains cautious as traders weigh macro uncertainty, upcoming inflation data, and the potential return of liquidity from U.S. institutional desks once regulatory clarity improves.
Momentum Shifts Toward Bullish Territory
As of Nov. 10, Bitcoin’s daily chart showed improving momentum. The MACD histogram turned green, while daily RSI approached the neutral 50 level, suggesting early signs of a bullish reversal.
Short-term traders continued to monitor the $108,948 resistance and $104,239 support levels identified by the Fibonacci structure. A sustained move above $109,000 could invalidate recent bearish setups and confirm renewed upside momentum.
With spot trading oversight now on the CFTC’s agenda, institutional confidence appears set to rise, potentially laying groundwork for broader adoption among U.S. investors.



