
 IGNITION
 streamoors
 Injective
 NEAR Protocol
 Pearl
Pearl LayerZero
 Quantus

Solana price has remained under pressure in the past few months despite having major developments. This includes the Bitwise and Grayscale ETF approvals.
SOL price has dived to $156, down by 40% from its highest point in September. This crash may accelerate soon a death cross emerges, and key metrics like addresses and transactions plunge.
Solana Price Could Form Death Cross Pattern
The daily timeframe chart shows that the Solana price has been in a strong downtrend in the past few months. This crash occurred as it formed a double-top pattern at approximately $238.
Its neckline was at $191, which coincided with the lower side of the ascending channel shown in orange.
Now, the coin is about to form the risky death cross pattern. This happens when the 50-day and 200-day Exponential Moving Averages (EMA) cross each other when pointing downwards. It usually leads to more downside over time.
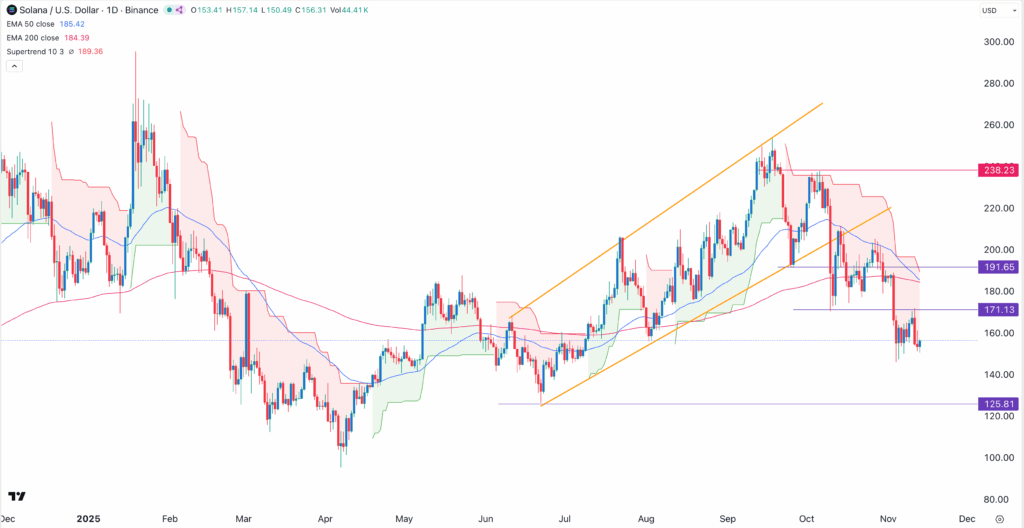
SOL price is also slowly forming a bearish flag pattern. A vertical line and subsequent consolidation characterize it. Similar to the death cross, this is one of the most common bearish indicators in technical analysis.
Solana price has formed other highly bearish patterns. For example, it has constantly remained below the Supertrend indicator, one of the most popular bearish patterns.
Sellers may push the coin lower, with $125 as the next key support level. This matches its June low, signaling potential downside pressure. This target price is about 20% below the current level.
Solana Transactions and Addresses are Falling
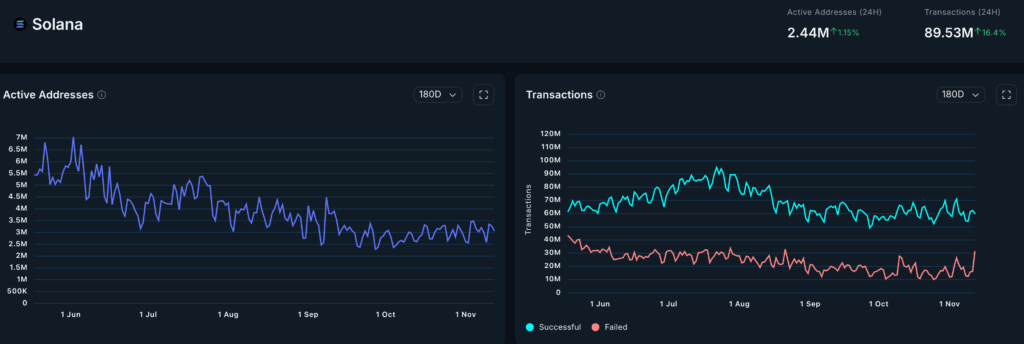
SOL price may drop further due to weak network performance. Nansen’s on-chain data shows declining activity and usage.
One of these numbers is the number of its active addresses. They have declined by over 50% from the highest level in June. They have fallen from about 7 million in June to 3 million today.
The same is happening in terms of the number of activities in the network. These have plunged to 62 million, down from 90 million in July this year. This crash has coincided with the fizzling of the meme coin ecosystem.
Data compiled by CoinGecko shows that Solana meme coins are a shadow of their former self. Their market capitalization is now $6.8 billion from a peak of $25 billion in January.
Official Trump (TRUMP), which was launched in January, has seen its valuation drop to $1.5 billion from almost $10 billion. Bonk’s market capitalization has plummeted to $1 billion. On the other hand, Pudgy Penguins and Dogwifhat have dropped to $917 million and $483 million, respectively.
The decline in transactions has resulted in lower fees within the network. Nansen data shows that Solana’s total fees have dropped by 30% in the last 30 days to $19 million. This fee is much lower than Tron’s $35.2 million, Binance Smart Chain’s $35.14 million, and Ethereum’s $27 million.
Solana ETF Inflows and DEX Performance
Meanwhile, the Solana price has crashed despite having some of the best fundamentals. One of these is the substantial demand for Solana ETFs from American investors.
SoSoValue data shows that the Bitwise and Grayscale SOL ETFs have had inflows on all days since their approval. They have added $368 million in assets since approval, bringing their total assets to over $574 million.
Another positive is that Solana has now overtaken BSC and Ethereum in terms of decentralized exchanges (DEX) volume. Its protocols handled $3.8 billion in volume in the last 24 hours, bringing the 30-day figure to $135 billion.
These numbers were higher than BSC’s and Ethereum’s $99 billion and $86 billion. SOL price has crashed in the past few months, moving from over $253 in September to $155 today.
Solana’s price may continue to fall in the short term. A looming death cross, positioned below the Supertrend indicator, points to $125 as the next key target.



