NEAR Protocol
 Bitcoin
 Aerodrome Finance
 Pearl
Pearl Uniswap
 Quantus
 Pudgy Penguins

Dogecoin price is showing early signs of potential strength after weeks of persistent decline. Traders are seeking momentum indicators that are now signaling a possible short-term reversal. Market focus is also on the rise, with various technical indicators converging to form a major support area.
Bullish Signals Strengthen for Dogecoin Price
Trader Tardigrade identified a rare bullish divergence in the daily RSI. Dogecoin price formed a lower low, and the RSI formed a higher low. This is the first bullish divergence in the current downtrend on the daily chart. Divergence signals are often bearish momentum indicators and can hint at a reversal attempt.
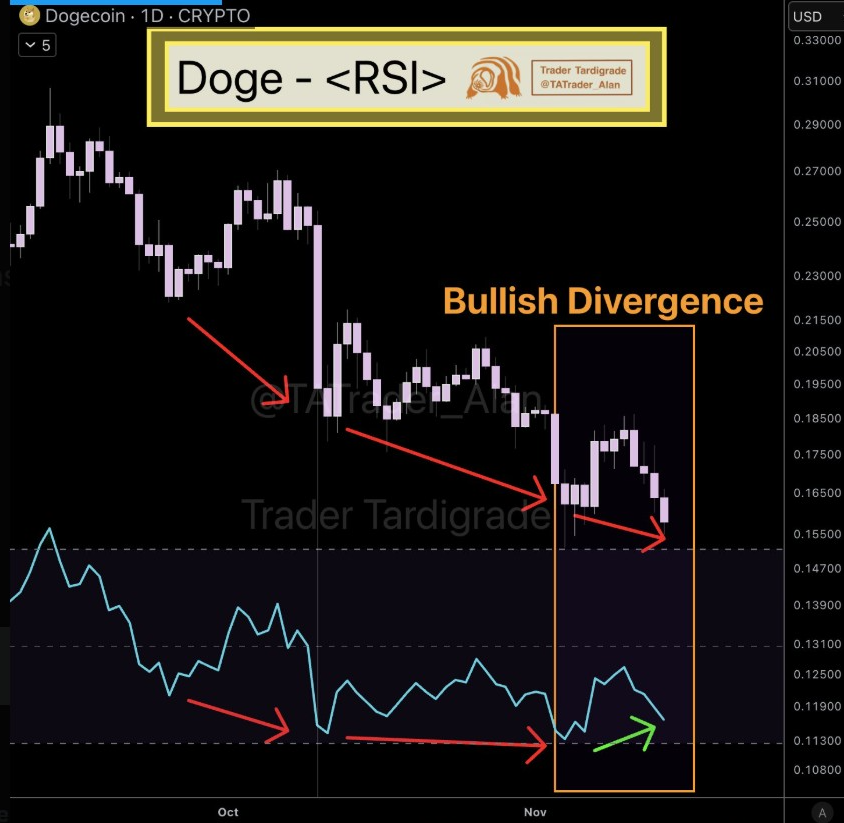
The daily chart revealed that since early October, there have been consistent lower lows. Price action remains pressured, but we can see a loss of momentum. The RSI divergence is near the $0.155 zone, which has been a short-term support area.
Traders could pay close attention to this level for a rebound confirmation. Divergence is not a guarantee of an immediate recovery, but it is an indication of a potential change.
Momentum Builds Around the Gaussian Channel
Tardigrade’s second chart centers on the 3-day Gaussian Channel. Dogecoin price actually dipped below the channel recently, and historically, this has preceded a big rally. The trader cites several past examples of similar dips that led to strong bullish cycles. Each dip caused notable upside moves within weeks.
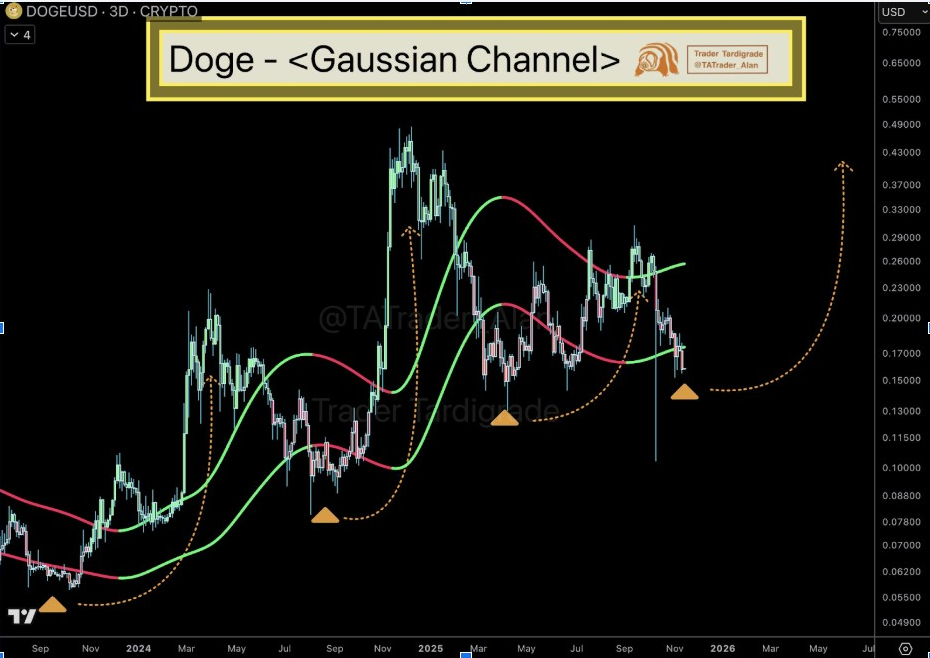
The current dip reflects these historical patterns. Price action remains below the green band, but buyers have defended the levels. The setup is similar to a tradable Gaussian retest before momentum expansion.
The dotted path on the chart is the potential medium-term recovery if the structure holds. Traders could view volatility as buyers attempt to reestablish the band.
DOGE Attempts a Rebound From Local Support Levels
According to BitGuru, DOGE is trading in a downward trend following its rejection at $0.183. Lower highs have prevailed in the structure over the past few days. Dogecoin price hit support near $0.160 before attempting a mild rebound. This rebound meets resistance at $0.166-$0.168, the next breakout threshold.
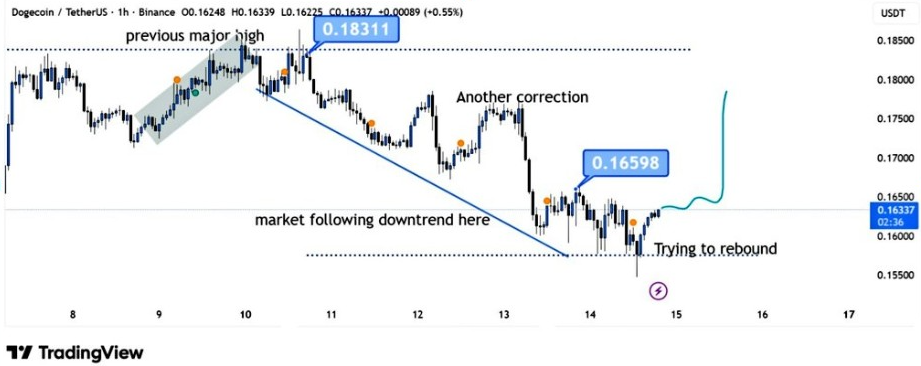
DOGE price structure changed into a channel of lower highs and lower lows. A break above $0.168 could confirm early strength. Failure to recover this level may continue the downtrend. Volume is still modest, suggesting caution among traders awaiting better confirmation. The rebound attempt is still weak but improving.
Weak Support Below $0.16 Raises Volatility Risks
Ali Charts showed a critical risk zone for DOGE. Below $0.16, support becomes thin quickly according to the UTXO Realized Price Distribution chart. Dogecoin price is above a significant liquidity gap extending towards $0.07. The next big cluster of demand is around $0.073, where billions of DOGE were previously accumulated.
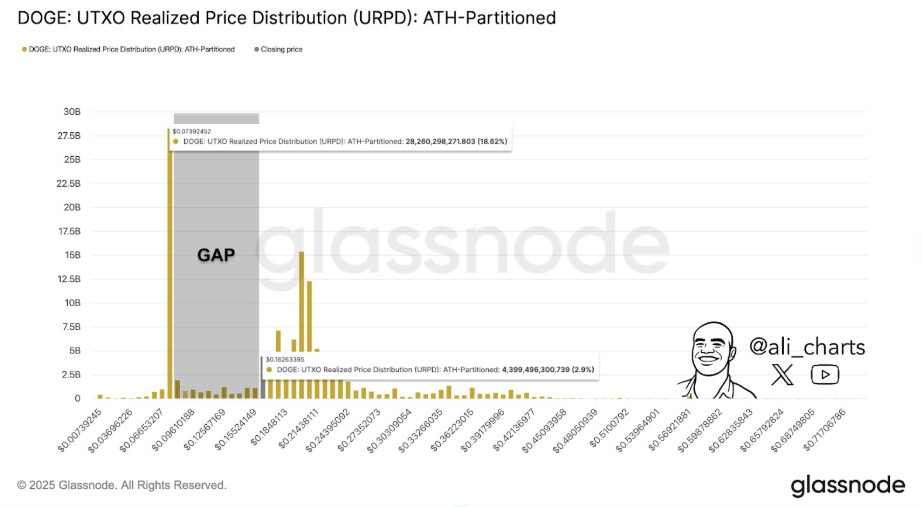
The URPD chart showed a heavy concentration between $0.16 and $0.24. Yet, it also reveals a significant void beneath this band. If the price fails to hold $0.16, DOGE could slip into this low-liquidity region relatively quickly. Traders should keep in mind that gaps often accelerate moves. This does not guarantee a drop, but it does increase the risk of volatility.
Ali Charts highlighted that this structure is similar to previous distribution phases. Momentum loss and weak support can lead to sharp price movements. However, the RSI divergence may offset downside pressure in the near term.
Market direction may now be highly dependent on Bitcoin‘s movement. DOGE tends to follow the general sentiment closely due to high retail participation.