astronaut
 Zylo Ecosystem
 Pearl
Pearl Quantus
 Bitcoin
 Sui
Sui Bitway

Bitcoin (BTC) remains the most influential cryptocurrency and a key component in determining market direction. However, the current market cycles require subtlety, as blind optimism often traps most traders in long positions at the top when the market is in decline.
While the public was following the market’s sentiment blindly, Bitcoin was throwing hints at a potential top. Bitcoin’s cycle shifts, piled-up shorts, and technical breakdowns were some of the signals that everyone was ignoring. Is a top in for BTC?
Here’s Why Bitcoin BTC Market Cycles Deserve Nuance
On the charts, Titan of Crypto set up main cycles for Bitcoin price since 2012 with the relative strength index (RSI) leaning toward bearishness. According to the analyst, Bitcoin was 80% bearish and 20% bullish, with bear confirmation following a similar close in November.
Every time the price of Bitcoin reached a high alongside the RSI, and the indicator broke its trendline support, BTC entered a bearish phase. The biweekly chart was critical, as it filtered out the noise seen in smaller timeframes, providing a clearer view.
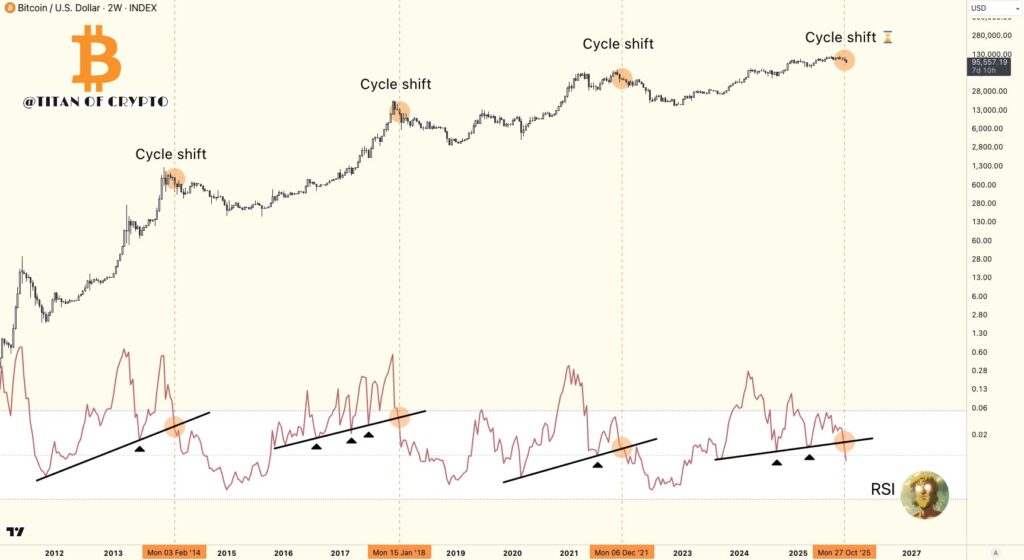
The current data showed that Bitcoin had broken below the most recent support of the RSI. This was the first sign that it was getting ignored by traders who were blindly bullish even as BTC dipped below $100K.
Additionally, Bitcoin’s one-year inactive supply exhibited a similar cyclical behavior. Historical data showed that inactive supply signaled market tops, which was followed by major selling as the current one. A similar pattern was forming, indicating that the bottom was yet to be reached. This meant further sell-off was coming.
More Than $10B in Bitcoin BTC Shorts Piled: What’s the Impact on Price?
The analysis of the Bitcoin Exchange Liquidation Map revealed that shorts were dominating the market. The market accumulated more than $10 billion in BTC shorts, reaching its highest price level at $111,169. The cumulative short liquidation leverage indicated that most traders were biased toward a bear market for BTC.
For context, if BTC hit $100K, about $3 billion in shorts would be liquidated. For $110K and $115K, $10 and $11 billion worth of orders would be wiped out. These short positions could push the price of Bitcoin lower as odds of dropping to $90K continue to rise.
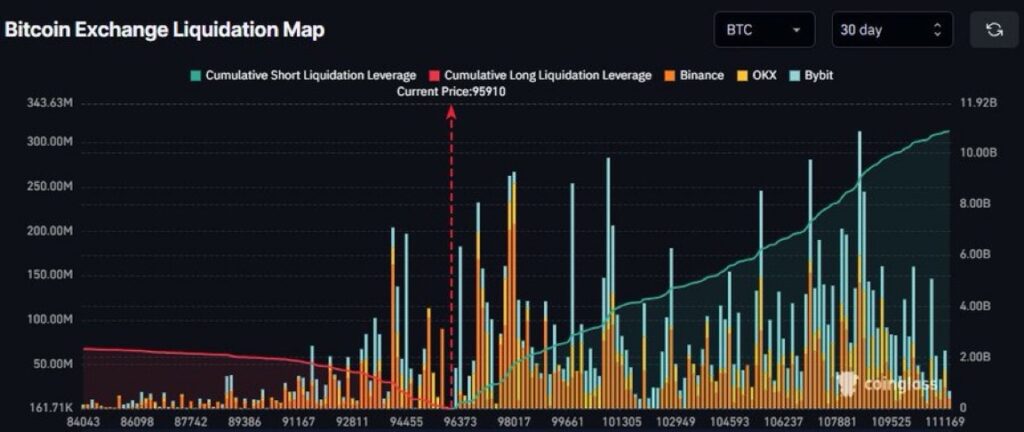
With most of BTC liquidity stacked above $96K, it seconded that Bitcoin might have hit its top. The level served as a resistance that was holding price backwards against a reversal.
Is The Top In For BTC Price?
Also, CT analysts were finally giving in that Bitcoin price was topping. For instance, Benjamin Cowen wrote, “If BTC closes below the 50W SMA today, then the odds of the top being in go up considerably (60-70%).” This conclusion was not far from what Titan of Crypto predicted, that he was about 80% bearish on BTC.

Technically, breaking below 50W SMA meant that the price had shifted bias on the weekly timeframe chart. As the price of BTC approached $90K, its market cap also dipped below $2 trillion, to $1.88 trillion when writing. The decline was another signal that BTC could have hit its top of the cycle, which was above $126K.
Altogether, the signals were hinting at a potential top for BTC, but a run on the liquidity resting above $96K could shift this outlook. However, it was more likely that BTC price had topped. But how deep can it go before a reversal?