
 Puffer
 ZKsync
 Bitcoin
 NEAR Protocol
 Pearl
Pearl Quantus
 Sui
Sui

An altcoin season could be on the way, as Bitcoin dominance plummeted to 58.87% today. This comes as BTC lost a multi-week ascending structure. The shift occurs after a significant collapse of the ascending wedge, which dominated in September and October.
The peak of the dominance was reached at the beginning of November, approximately at 61% and then rolled off. The next candles gave similar lower highs and lower lows, indicating an evident decreasing trend.
This selloff increased when dominance lost the ascending trend line at around 60%, which had been the support since the end of August.
This collapse is similar to the one that preceded the rotations of altcoins last time, specifically in October 2020. The period saw the Bitcoin dominance decline, triggering an altcoin season.
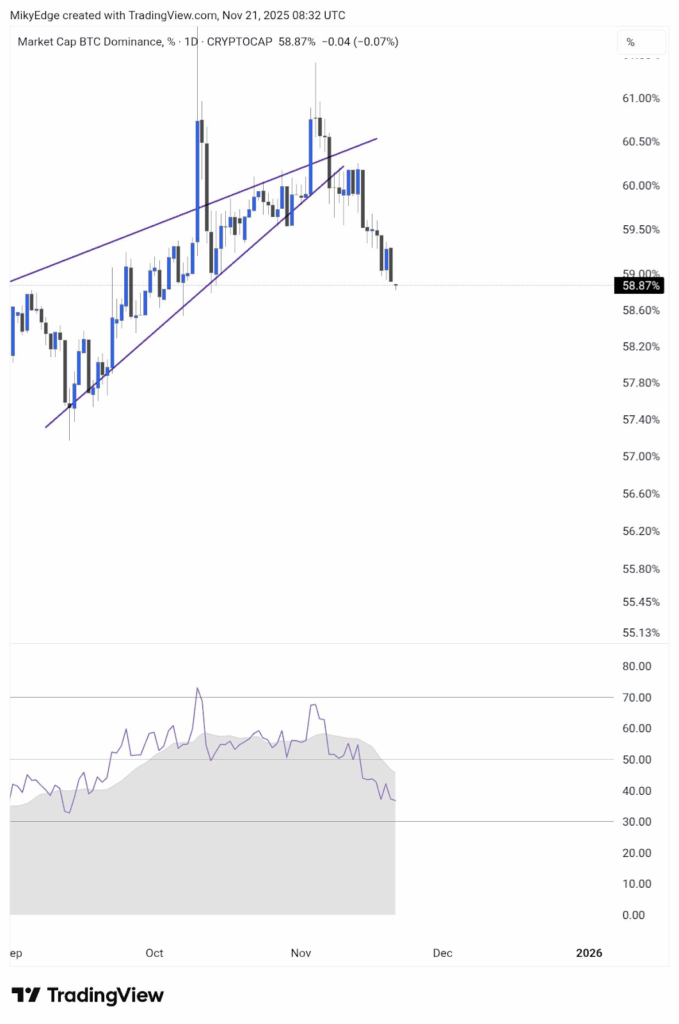
The RSI on the bottom pane is the one that facilitates loss of momentum. Momentum indicators have also decreased in the latter part of October and dropped to the 40 area.
The violation of trendlines, along with deteriorating momentum, characterizes the technical background, indicating that Bitcoin dominance is weak.
Current Market Structure Replicates the 2020 Altcoin Season
Monthly candles indicate that the altcoins are consolidating within a narrow range. That’s similar to the sideways band observed during mid-2018 to early 2020. The previous consolidation took about 18 months and then led to a 2400% growth in 2020 and 2021.
The same form of horizontal compression is present in the current structure, except that it is spread over late 2023 and 2024. Analysts highlight that the current technical pattern resembles the breakout phase of 2020 and point to the similarity in its duration, candle structure, and volatility patterns.
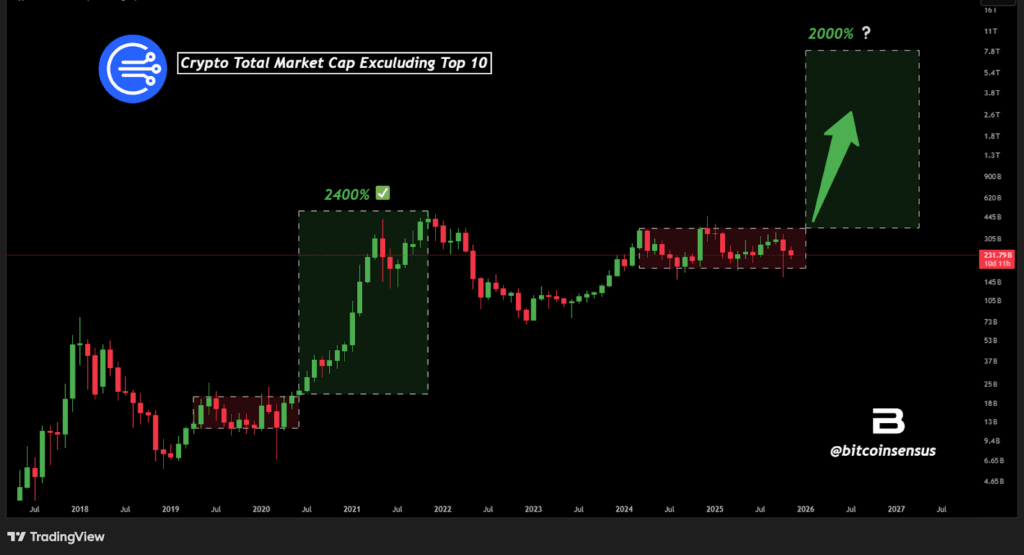
The present consolidation, unlike the last one, has yielded smaller monthly ranges. This indicates a long-term duration of capital stagnation, as liquidity is holed up at the upper end of the market during 2024 and 2025.
The analyst emphasized that the market cap is still low in the macro range. This indicates the historical midpoint of approximately $445 billion as a point of reference, where the expansion had been accelerating previously.
The ultimate solution of this range will be either via an upward solution or a further broadening of the consolidation. However, structurally speaking, the data offer the best comparison since the 2020 trend emerged.
Altcoin Season Index Slides to 27 as Rotation Signals Build
Further evidence, CoinMarketCap Altcoin Season Index indicates the indicator is at 27, well into the Bitcoin Season. The historical table, although the reading is low, indicates a gradual drop over the past week and month, since 33 and 28, respectively.
This is a step towards more depressed altcoin relative strength. The minimum was 12, which occurred in April 2025, and the maximum was 87, which occurred in December 2024.
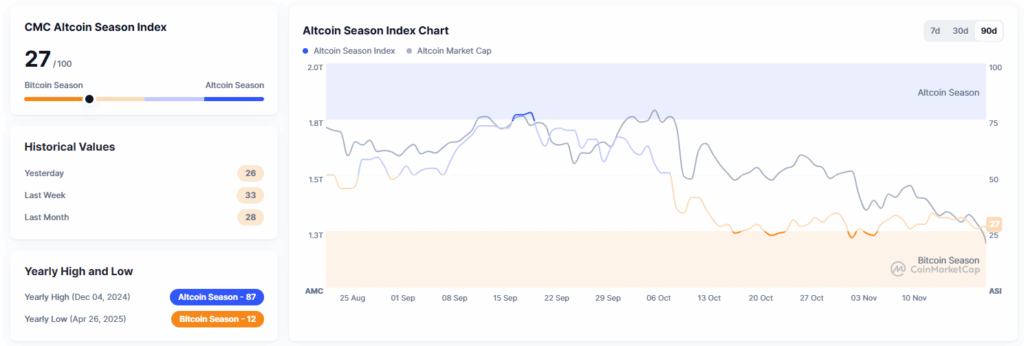
Despite Bitcoin dominating the market, the 90-day altcoin season index chart indicates an increasing disparity between the market cap of altcoins and the index itself. During September and the first half of October, the altcoin market cap remained around 1.8 trillion before dropping at the end of October.
Nevertheless, the index decreased more rapidly than the market cap of altcoins. The loss of a multi-month trendline by Bitcoin corresponds to the first stages of an altcoin season as seen in late Q3 2020 and early Q4 2020.


