
 astronaut
 Zylo Ecosystem
 Pearl
Pearl Sui
Sui Walrus
 Quantus
 Quant
Quant

The Sui price has reverted to a negative long-term trendline that has characterized its market structure since 2023. The trendline has been tested in the last two years only twice, resulting in massive expansions.
Multi-year diagonal support on the Sui price goes back to late 2023. The initial contact occurred in November 2023, when the price rebounded off the trendline. The move saw the price increase by around 443% up to early 2024.
A second communication occurred later in August 2024, resulting in a gain of over 746% in the subsequent months of the cycle.
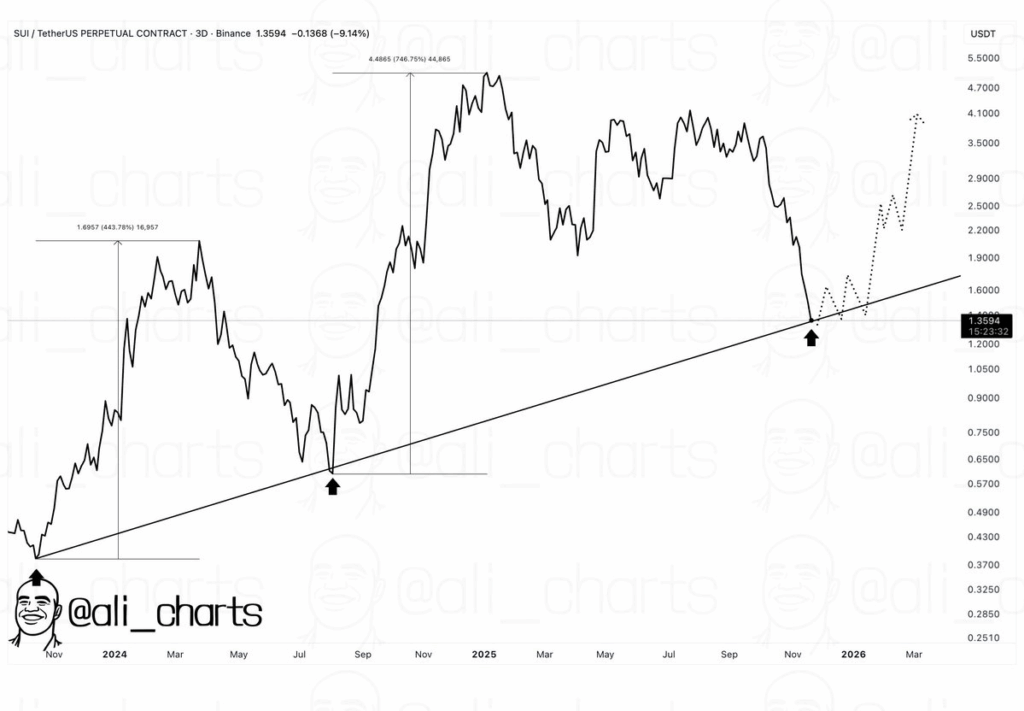
The chart also indicates that Sui is approaching the same diagonal level again. Analysts point out that the touch point could be around $1.30-$1.50 level, depending on the exchange.
The trendline has been a multi-year equilibrium, absorbing sell pressure every time a significant market reset has occurred. As Sui price is revisiting the level, the analyst indicates the sustainability of the trendline across several cycles.
Ali emphasizes the importance of Sui retaining the same support level, as it gained 450% in the early months of 2024 and then 750% gain in late 2024.
According to him, the two past rebounds were initially initiated by this trendline. The current touch is the third to be made since the inception of Sui, which could mean a similar pattern.
Stablecoin Liquidity Inflow Reaches Record 24-Hour Spike
Along with the price structure, Sui has seen impressive growth in the liquidity of stablecoins in its ecosystem. According to the second chart, Sui had a total supply of stablecoins that had grown by 2.4 billion. It is the highest number of daily networks that are monitored.
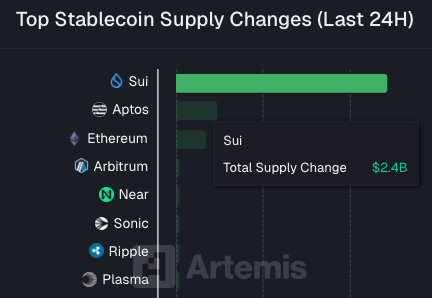
An inflow of stablecoin is commonly a proxy of the purchasing power on-chain. The peak of the case with Sui is the very retesting of the long-term support line. The data indicates the heightened funding action at a moment when Sui price is heading in the reverse direction along the trendline.
The immediate influx is also accompanied by an overall expansion of Sui network activity. The returning and new active users in the last three months have been stable. On several occasions, it has recorded numbers of one million and above.
This is backed by data from Artemis, which shows that the number of new and reactivation of old active wallets is continuously increasing. This proves that the network is not losing customers to the market pullback.
Sui Price Chart Reflects Heavy Downtrend Approaching the Support Zone
More chart data shows that Sui price has been in a clearly defined downward channel since August 2025. Each channel boundary has been rejected at price levels. That’s causing a definite trend of decreasing highs and decreasing lows.
The Awesome Oscillator is also indicative of continuous negative momentum in the decline.
SUI has just sat on the bottom of the channel and entered the horizontal support zone between $1.83 and 1.97. The support has provided a significant liquidity zone between March 2025 and July 2025.
A wider picture shows that several levels of support, the macro trendline, horizontal demand, and the lower channel boundary are all converging at the same area.
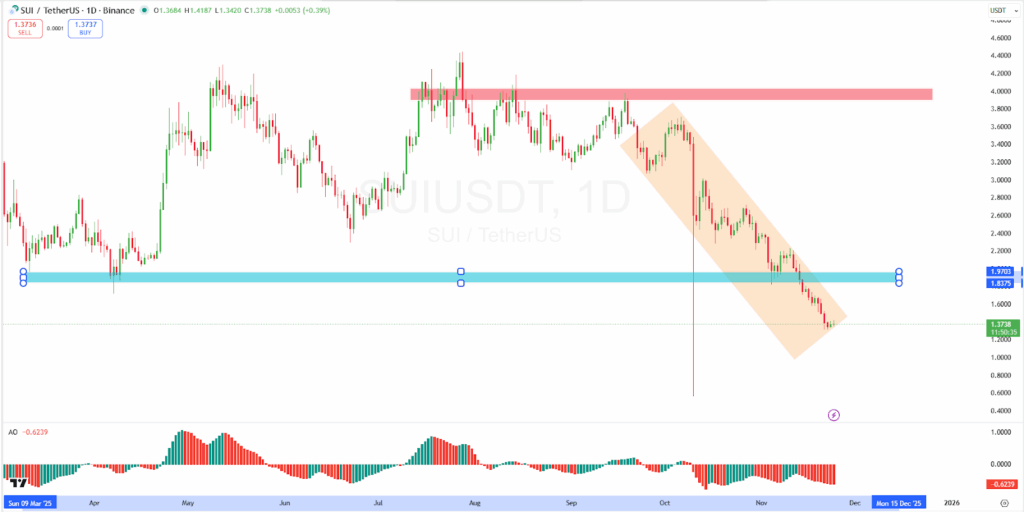
A combination of these technical aspects demonstrates a cross-section of structural supports at the precise price levels at which the price is currently trading.
The chart analysis also indicates that the current value of SUI/USDT is approximately $1.35-$1.37. This is a drastic retraction of the highs of the year. However, SUI price is in a zone from which it has reversed in past market cycles.




