
 Walrus
 Bitcoin
 Quantus
 Pearl
Pearl Quant
Quant Pudgy Penguins
 Sui
Sui

Dogecoin price is entering a compression phase amid weak on-chain support and a tightening technical structure. While the meme coin struggles to hold its current range, new signals are flashing a potential turning point. Analysts cite a possible breakout from the triangle pattern and bullish crossover signs on the MACD. But with a gap in holder support under $0.09, DOGE may still risk another drawdown before a true reversal forms.
Weak Market Support Raises Dogecoin Price Breakdown Concerns
Recent on-chain observations point to a gap in realized price support below Dogecoin’s current range. Ali, an on-chain analyst, reported that the UTXO Realized Price Distribution shows thin buyer concentration under prevailing prices. This indicates that fewer holders purchased Dogecoin in this region.
The next notable realized volume cluster sits near $0.081. This level historically coincided with an area of larger address accumulation. According to the distribution model, this serves as the next area where demand may emerge if weakness persists. The absence of holder density above this level creates a vulnerable space where price can move during stress periods.
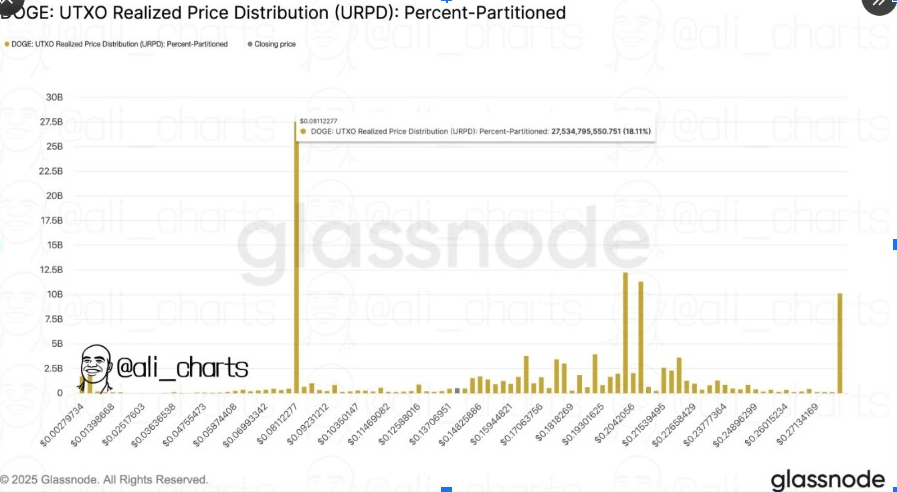
Volatility often contracts after sustained declines, forming a triangle structure like the one now on DOGE.” During previous declines, DOGE registered sharp candles in such regions, reflecting a trend where sellers dominate. If a market slowdown takes shape, Dogecoin price could revisit deeper areas of the realized range before finding support.
Triangle Formation Suggests a Developing Base
While on-chain data points toward a vulnerable structure, the 12-hour chart shows a symmetrical triangle forming near the current range. Trader Tardigrade identified this pattern as a period of compression marked by lower highs and higher lows. The structure generally appears after sustained declines when volatility starts to contract.
Triangular structures represent a balance between buyers and sellers. In Dogecoin’s case, the pattern shows shallower lows, indicating that sellers are struggling to push the market back to previous depths. Higher lows often appear when early accumulation begins to form in compressed ranges.
A breakout above the upper boundary of the triangle may open a path toward the $0.15–$0.16 area. Measured-move projections support this target based on the width of the pattern.
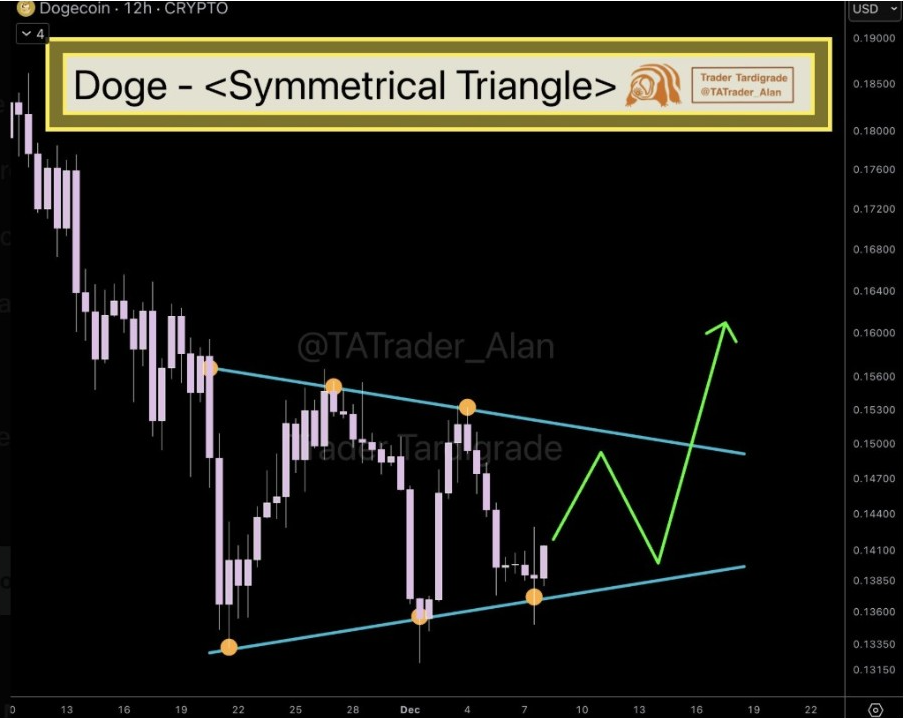
For this scenario to develop, DOGE must maintain the lower boundary and show sustained volume expansion during any attempt to exit the formation.
A failure to hold the lower trendline would align the market more closely with on-chain readings. Such a move would place $0.081 back in focus as the next support level.
Weekly Pullback Nearing Completion
Dogecoin price weekly structure appears to be progressing through the late stages of a complex pullback. Similar patterns appeared in previous cycles after strong impulses, followed by extended overlapping corrections.
In 2023 and 2024, comparable formations preceded multi-month recoveries once the structure tightened and directional pressure shifted.
Moreover, current weekly structure reflects a series of lower highs and higher lows that continue to converge. The analyst reports that this phase often ends when momentum resets and price exits the boundary of the descending structure.
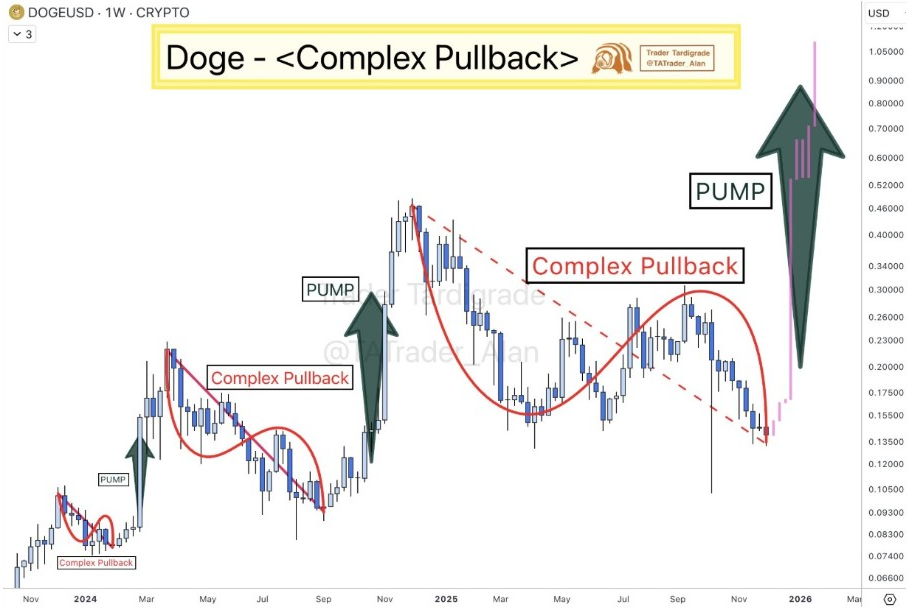
If DOGE maintains its long-term support, the next move could resemble the pattern observed before earlier trend reversals.
The chart comparison shows repeated sequences where compression preceded breakouts. Current placement near the lower band matches earlier stages where demand strengthened.
MACD Approaches a Bullish Signal
Additionally, the three-day MACD is nearing a potential bullish cross. Previous crosses in April, July, and September 2024 were followed by multi-week upward legs. Each instance appeared after extended selling pressure eased and the indicator recovered from depressed levels.
The current convergence between the MACD line and the signal line suggests that momentum could transition if buyers maintain stability. Earlier cycles showed directional follow-through once the cross appeared.


