
 IGNITION
 streamoors
 Injective
 NEAR Protocol
 Starknet
 Quantus
 Bittensor

Ethereum has moved back to one of its most significant technical zones after weeks of downside pressure. Price action is now all about the $2800 area, which is a very popular zone to watch for traders to confirm. This retest is coming with market sentiment remaining fragile and conviction divided.
The broader cryptocurrency market is exhibiting uneven momentum, adding uncertainty to Ethereum‘s outlook. Bitcoin is stuck in a range, and altcoins struggle to emerge as leaders.
Against this backdrop, Ethereum’s response at $2,800 has greater implications.
Ethereum Price Structure Tightens Near $2,800 Support
Ethereum’s recent fall brought the price back down to a long-observed demand area. The $2,800 level was prior resistance, which turned into support. Such flips are often turning points in much larger trends.
Daily candles showed repetitive reactions near this area. Several sessions have created long lower wicks, indicating that buyers are defending the zone. However, there has been limited follow-through that keeps momentum muted.
Ted Pillows said holding $2,800 could provide a recovery toward $3,000. That region overlaps previous areas of consolidation and visible supply clusters. A sustained movement above it would take renewed buying strength.
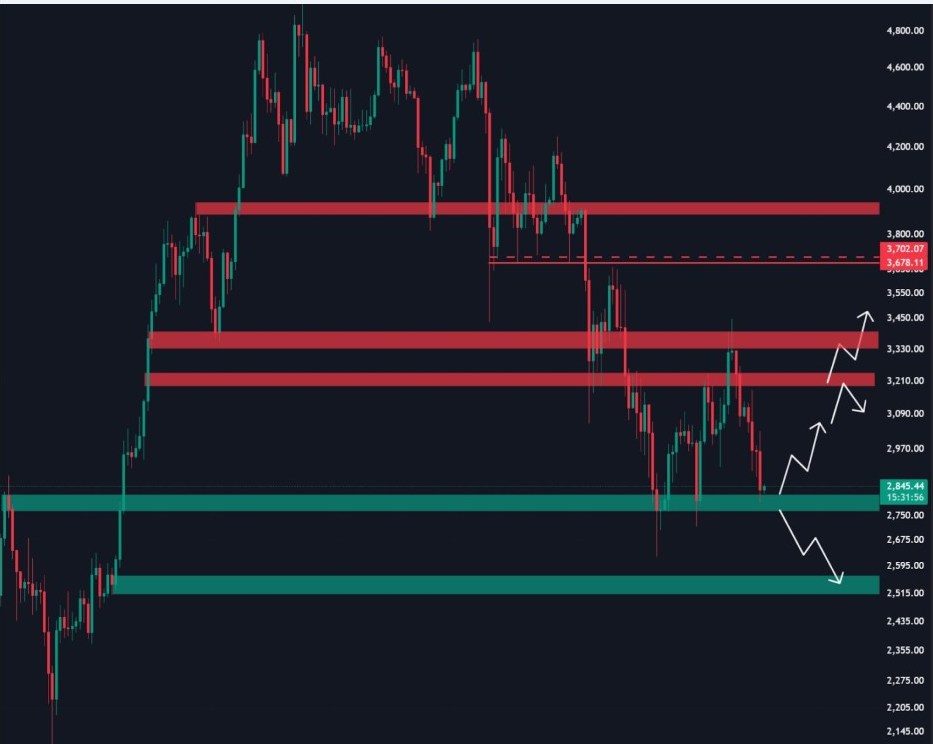
Failure to hold $2,800 could lead to lower support for Ethereum around $2,500. That zone represents a previous accumulation area from earlier in the year. Market structure is more of a caution than a confirmation of the trend.
Whale Activity Adds Complexity to ETH Outlook
On-chain data showed meaningful wallet activity during Ethereum’s pullback. Lookonchain identified a wallet, which may be linked to Erik Voorhees, that had become active again. The wallet was open for ETH and Bitcoin Cash after being dormant for several years.
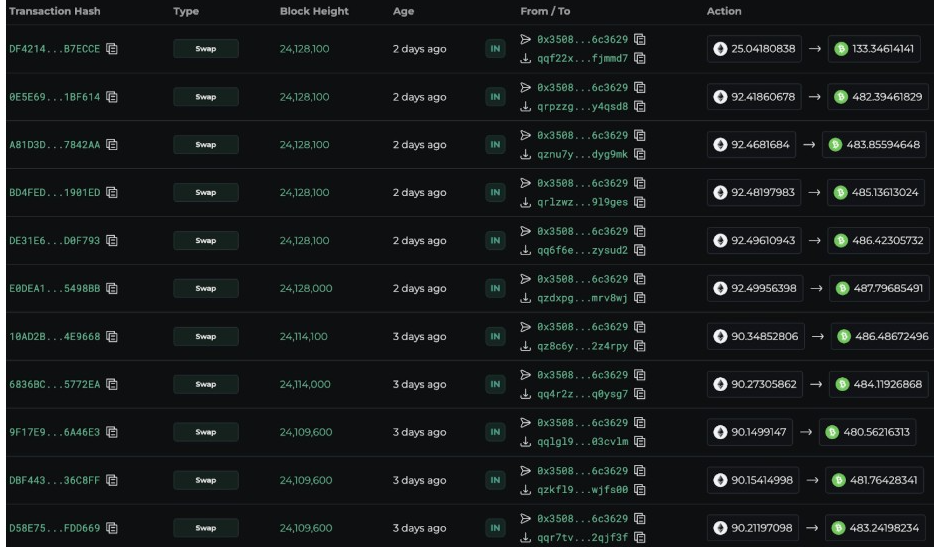
Over the course of two weeks, the address sent over 4,600 ETH in multiple transactions. The activity implies portfolio rebalancing and not sudden liquidation. Such moves are often made during a time of uncertainty.
Large holders tend to increase exposure in anticipation of volatility. These reallocations can put temporary selling pressure without changing long-term narratives. Ethereum price absorbed the flows without significant breakdowns.
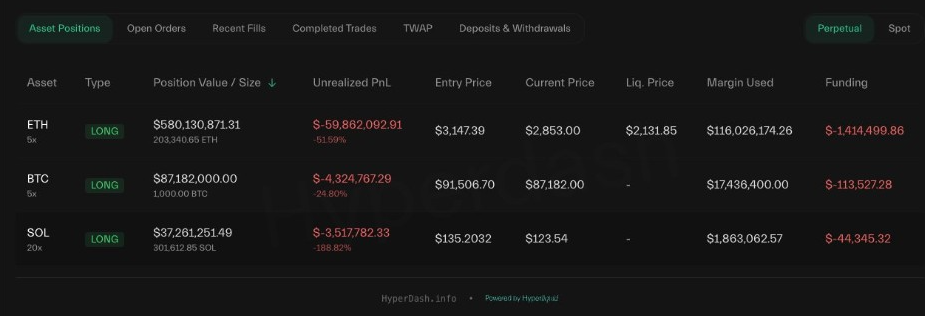
At the same time, other whales are in the opposite position. Coin Bureau reported that a major ETH long position is growing to exceed $575 million. This contrast has highlighted divided expectations among influential market participants.
Derivatives Positioning Indicates Increasing Risk
Ethereum’s derivatives market remains a significant contributor to short-term price fluctuations. Open interest remains high despite recent price weakness. This combination increases sensitivity to sudden movements in one direction.
The current whale long position has some significant unrealized losses. Large leveraged positions can increase volatility when the price is close to liquidation levels. Such dynamics often bring sharp intraday moves.
Ethereum is faced with layers of resistance between $2,950 and $3,050. These zones follow previous levels of breakdown and high-volume nodes. Reclaiming them would require good spot demand.
Until then, derivative positioning may continue to affect price swings. Traders are always cautious, knowing that crowded positioning can unwind quickly. This environment is conducive to reactive trading, not trend chasing.
Trendline Tests Keep Ethereum Traders Cautious
Shorter timeframes indicate Ethereum testing an uptrend line from October. Justpitt’s analysis puts this trendline around the $2,850-$2,900 area. The region overlaps with previous demand and the monthly open.
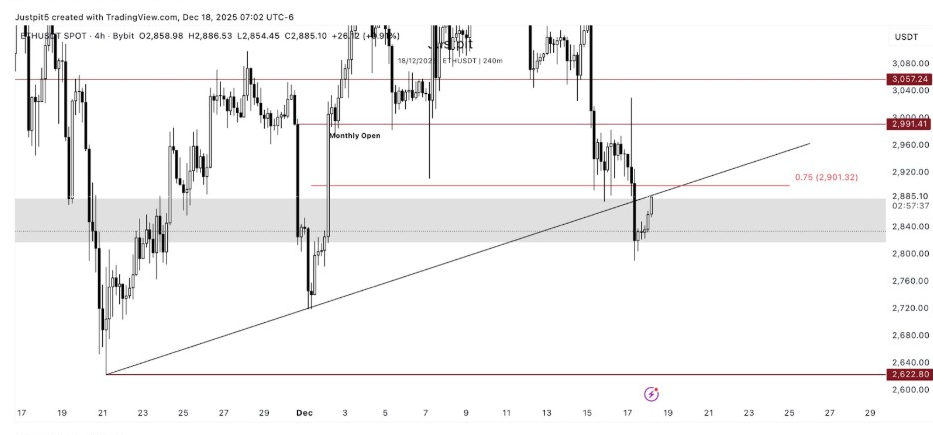
ETH price briefly dipped below the trendline and bounced right back up. Such behavior is often a sign of indecision, rather than an immediate reversal. Confirmation is normally required to be multiple closes above the level.
The $2,900 zone is now a near-term pivot. Holding above it might stabilize the structure and welcome cautious bids. Losing it would probably result in a shift in emphasis to areas of lower liquidity.
The overall structure of Ethereum remains compact. Neither bulls nor bears have been able to exercise control clearly.



