
 Pearl
Pearl Zylo Ecosystem
 Starknet
 Walrus
 Sui
Sui Bitway
 Pons
Pons

Bitcoin price short-term outlook remains bullish, although a potential threat appears to be looming. The largest cryptocurrency leads the entire market by capitalisation. Also, more signs are aligning toward a bullish uptrend trajectory.
Despite the network activity declining, it was positive for BTC. However, the stablecoin supply ratio, RSI, and MACD showed that the trend was under threat. In this piece, we’ll be expounding on why the Bitcoin price rally was not guaranteed.
Bitcoin Price Holds CME Support Amid Volatile Trading
Bitcoin price was trading close to $87,470, which was very close to Friday’s CME close. This meant that there was no CME gap at the weekly open as of press time.
The price was holding steady above the $87,000–$87,200 support zone on the one-hour chart. Traders bought in this zone during the day. They acted after BTC sharply dropped from the $89,400 resistance level.
If the Bitcoin price stayed above this range, it showed that people were willing to buy in the short term. This could lead to a move back toward $88,200 and the supply area between $89,000 and $89,500.
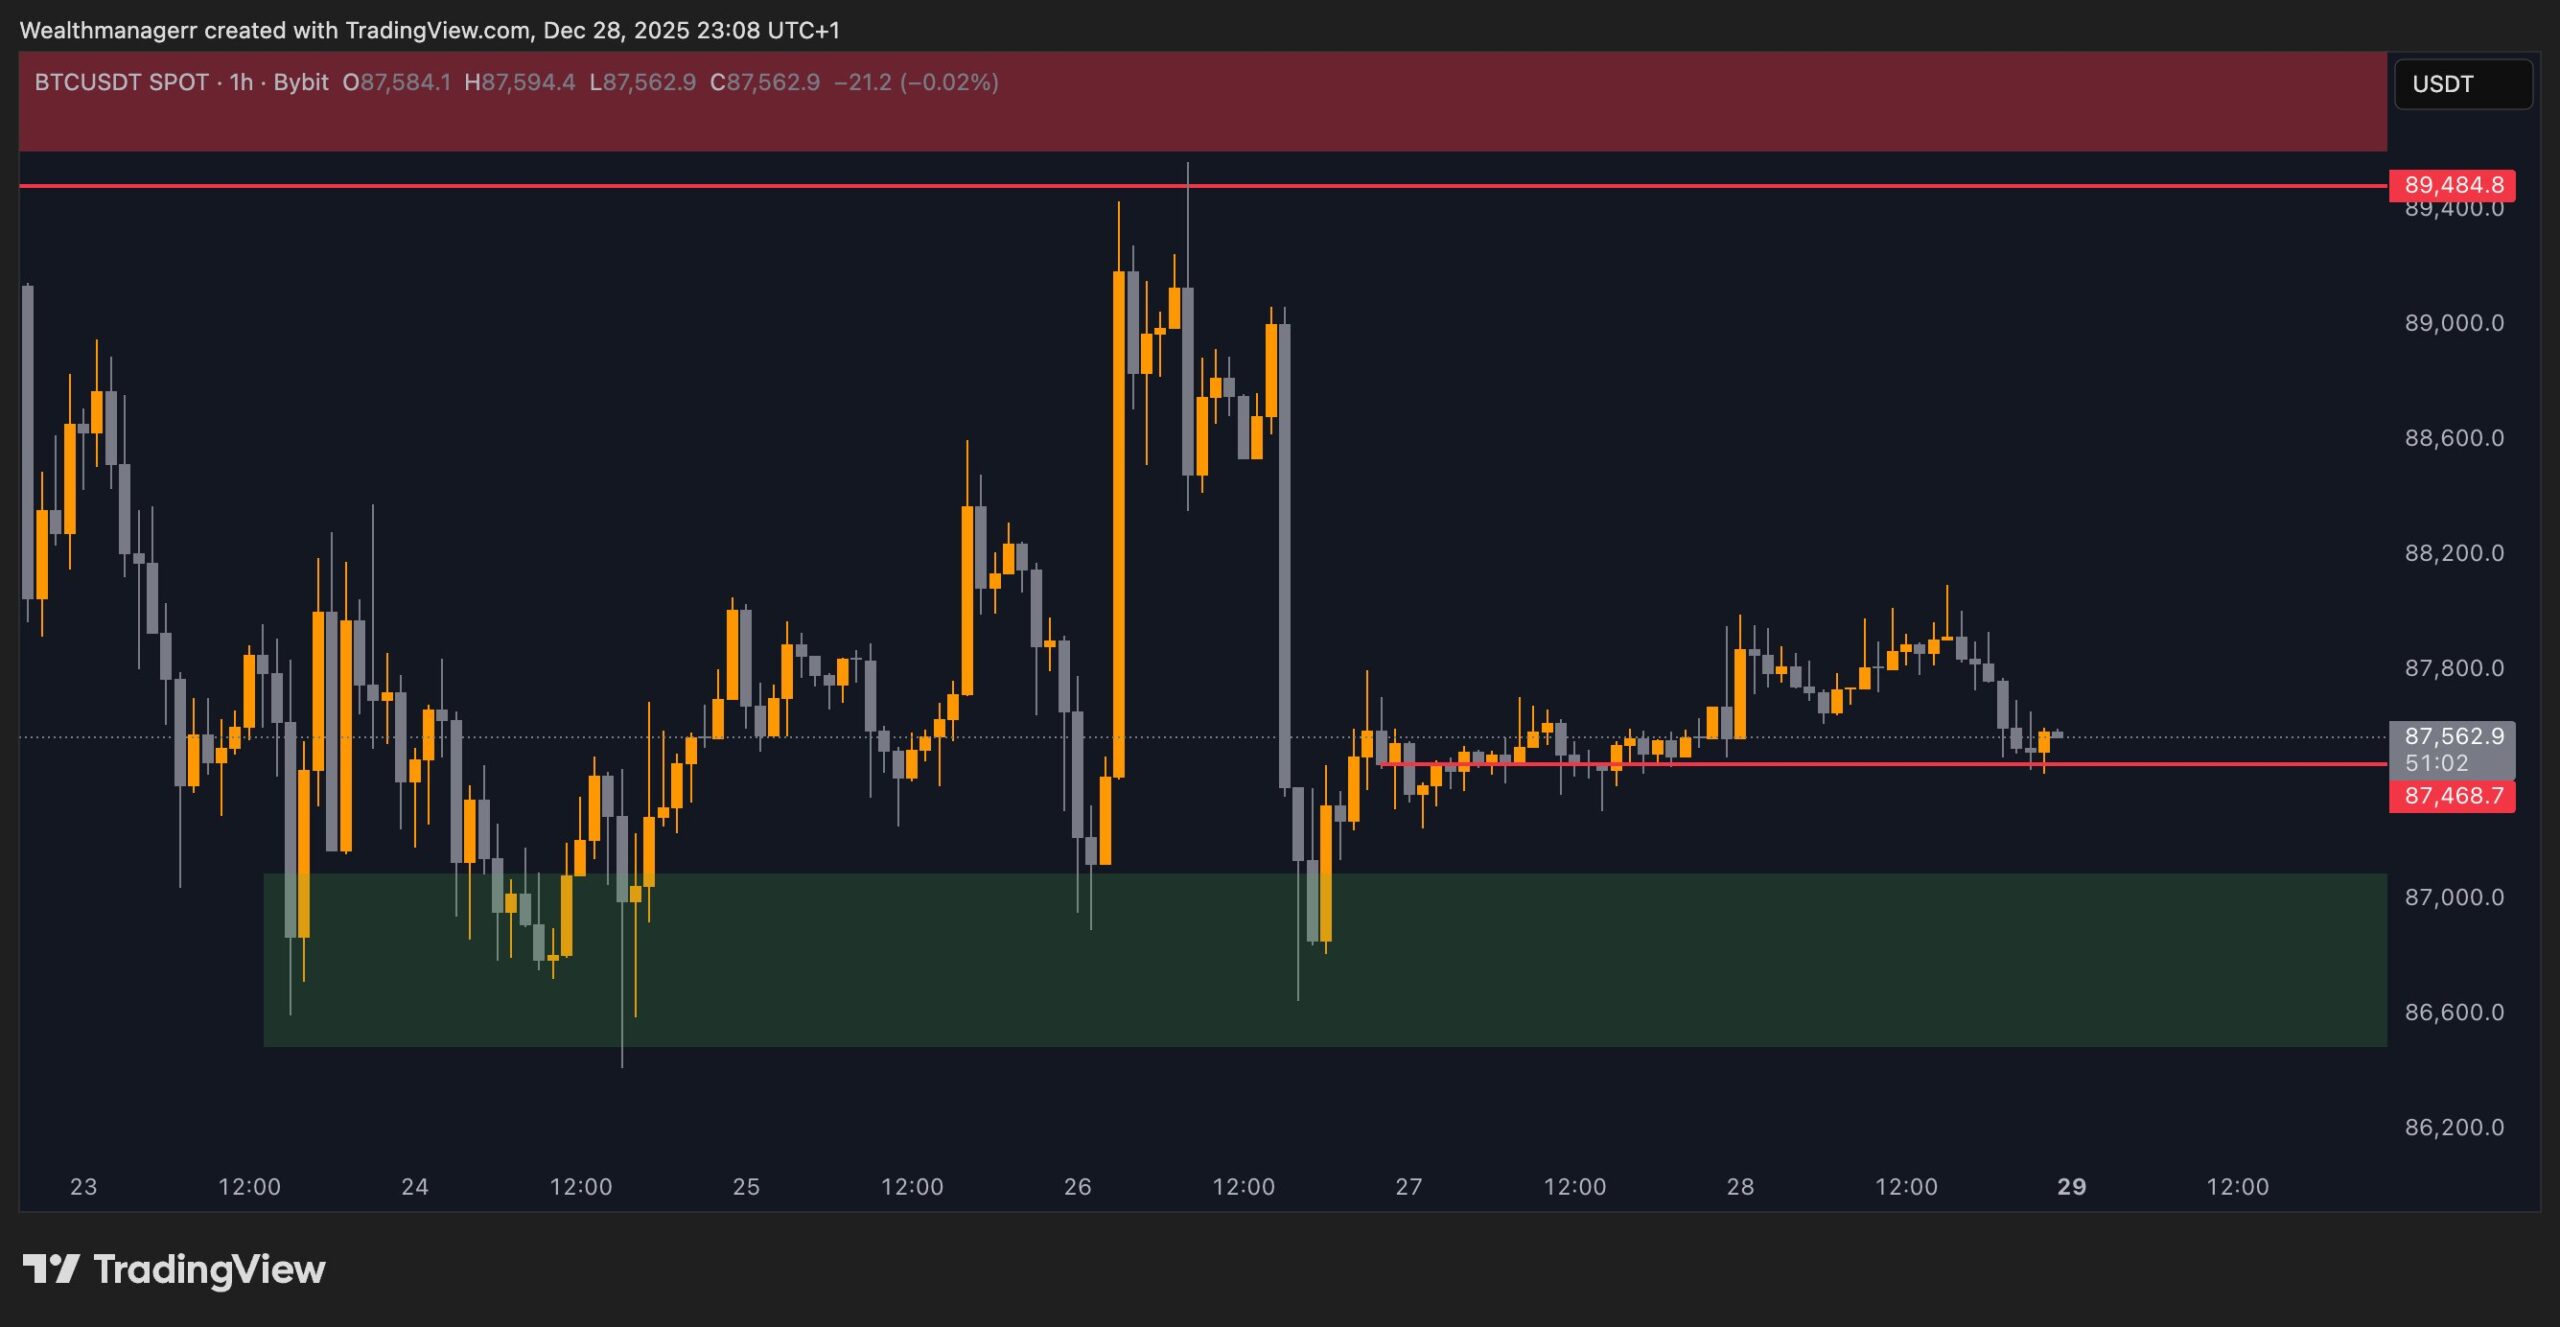
However, repeated failures near $88,000 showed that momentum was fading. If the price dropped below $87,000, the bullish bias would be invalidated. Furthermore, the liquidity would be available between $86,200 and $86,500.
In the meantime, the price structure favored a small rise as long as the CME support held. However, volatility was still high around these levels.
Bitcoin Active Addresses Decline Signals Mixed Bitcoin Price Outlook
Ali Charts on X shared Glassnode data that showed Bitcoin’s unique active addresses from 2016 to 2025. These addresses rose to 22.98 million in early 2021. Then, it dropped to about 18 million by mid-2022. Still, they keep dropping until they reach 12.84 million by late 2025.
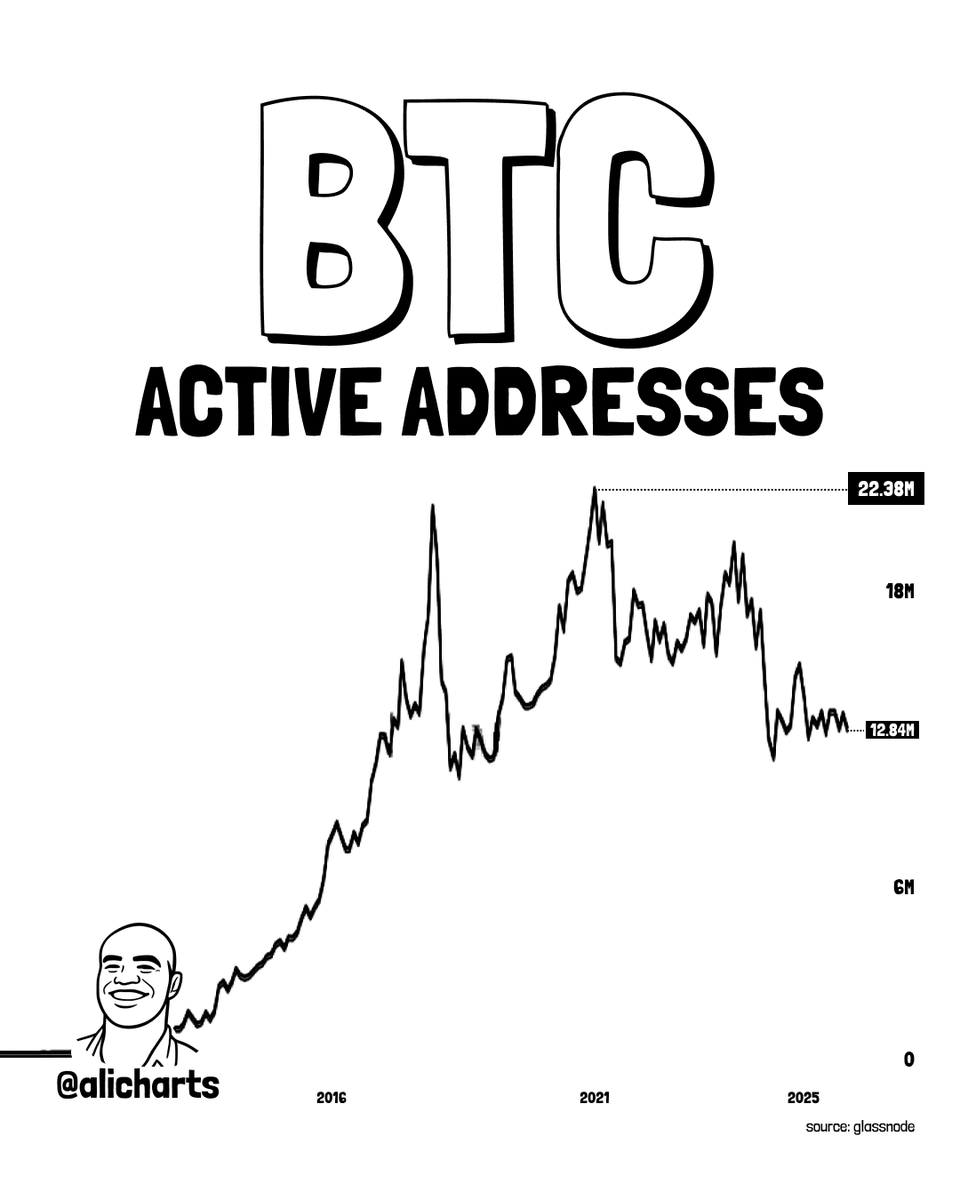
The data said this was a 42.6% drop from the high in 2021. This showed that network activity increased during the bull markets from 2017 to 2021, then steadily decreased.
Bitcoin saw fewer transactions as it shifted into a store-of-value asset. Traders used it less as a currency for everyday use.
This decline was bullish, as it reduced selling pressure from holders. This meant that the Bitcoin price was bullish. However, other technical and fundamental metrics were pointing toward a downtrend. The result risked putting BTC into a downtrend.
Stablecoin Supply Ratio, RSI, and MACD
As per the CryptoQuant chart, Bitcoin’s Stablecoin Supply Ratio (SSR) from August 2025 to December 2025 was declining when overlaid. Bitcoin price went from a low of about $86,000 in to a high of about $126,000 in late 2025.
The momentum bars showed the trading volume, which went up during rallies. The SSR started at about 24 and reached its highest point in early 2025. Then, it dropped quickly to 11%.
The RSI at 14 fell from 45.51 to 30.03, showing that the momentum was slowing down. The MACD went from positive 0.038 to negative -0.135. This confirmed bearish divergence.
All these were a confirmation of a potential downtrend in a sea full of bullish action as 2025 comes to an end.
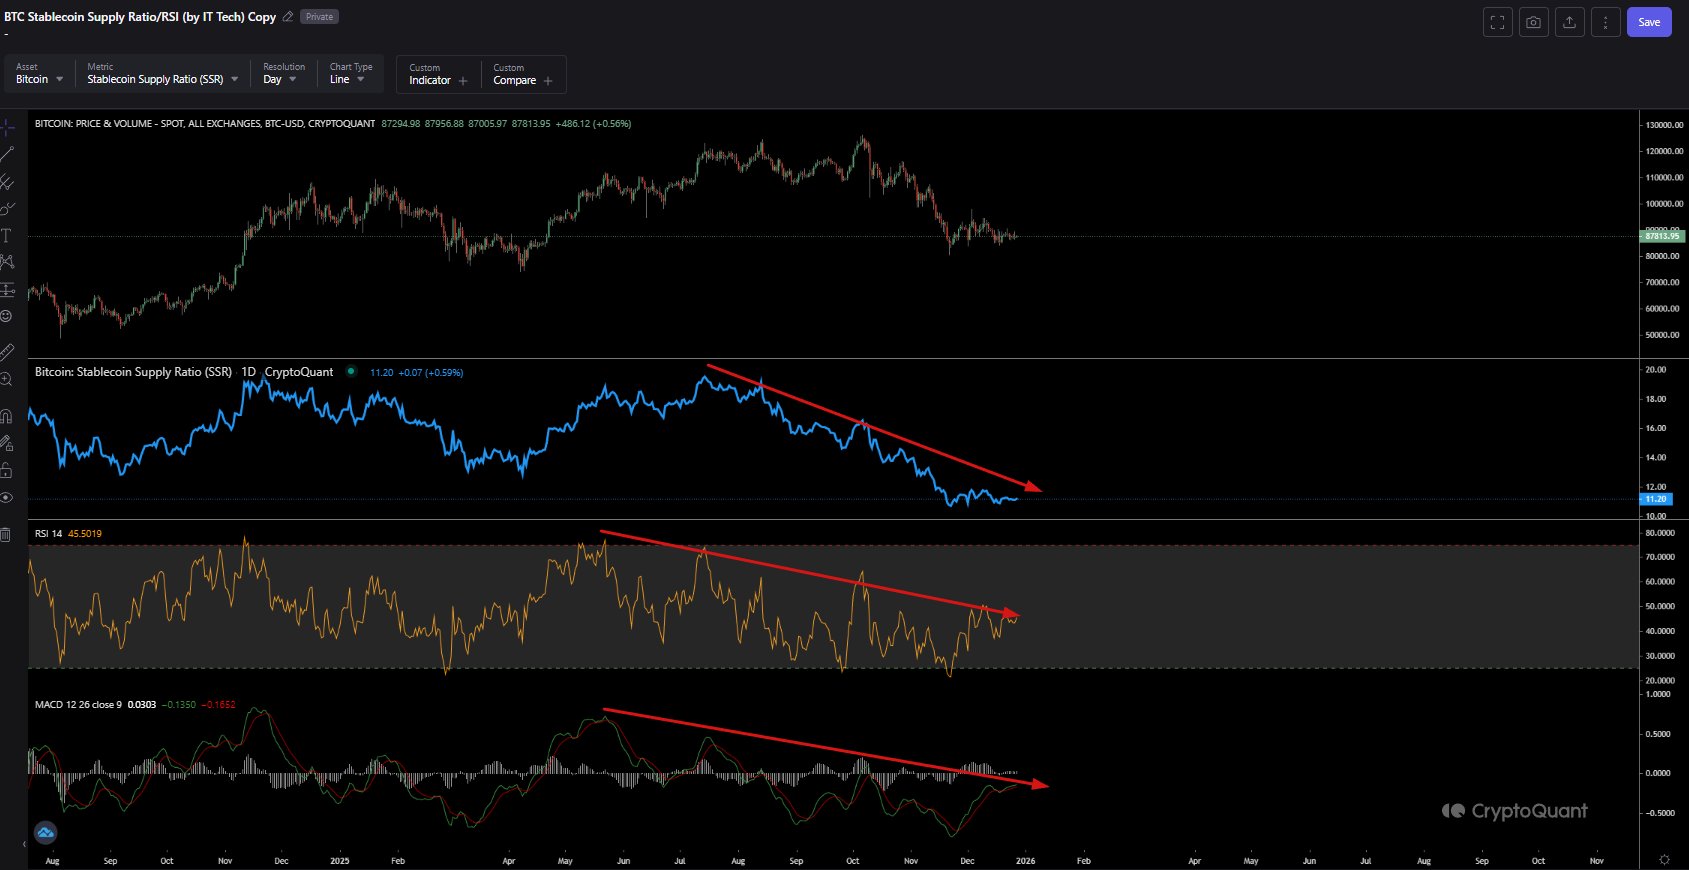
All these suggested that stablecoin “buying power” was declining while BTC was stuck in a sideways pattern. If this happened, there could be a chance for future gains. However, when writing, liquidity seemed to be low.
Thus, Bitcoin was in bullish sentiment in the short term, but indicators showed that it was not guaranteed.




