
 Bitcoin
 NEAR Protocol
 Pudgy Penguins
 Puffer
 ZKsync
 Bitway
 Pearl
Pearl

Dogecoin price is trading in a tight range after a fast rebound. Also, traders are watching for a confirmed break in either direction.
Analysts highlight holder cost-basis data and a daily bullish pennant after the trendline break. They also point to a monthly candle setup that signals a defended low. DOGE price action has been volatile, while liquidity remains active across major venues.
Dogecoin price holds near $0.14 after a 13% weekly rally. Trading stays contained between $0.144 and $0.153. The price action reflects stability in early 2026.
Daily turnover remained near $1.4 billion. This kept DOGE among the most actively traded meme coins as traders positioned around key technical zones.
Dogecoin Price Prediction: URPD Holder Map Shows Where Supply is Concentrated
A URPD shared by Ali Martinez shows the largest holder concentration near $0.073. This marked a major support zone on the distribution profile.
The same chart shows smaller supply clusters near $0.118, $0.147, and $0.177. URPD data is often used to estimate where holders built positions and where buy or sell pressure may appear.
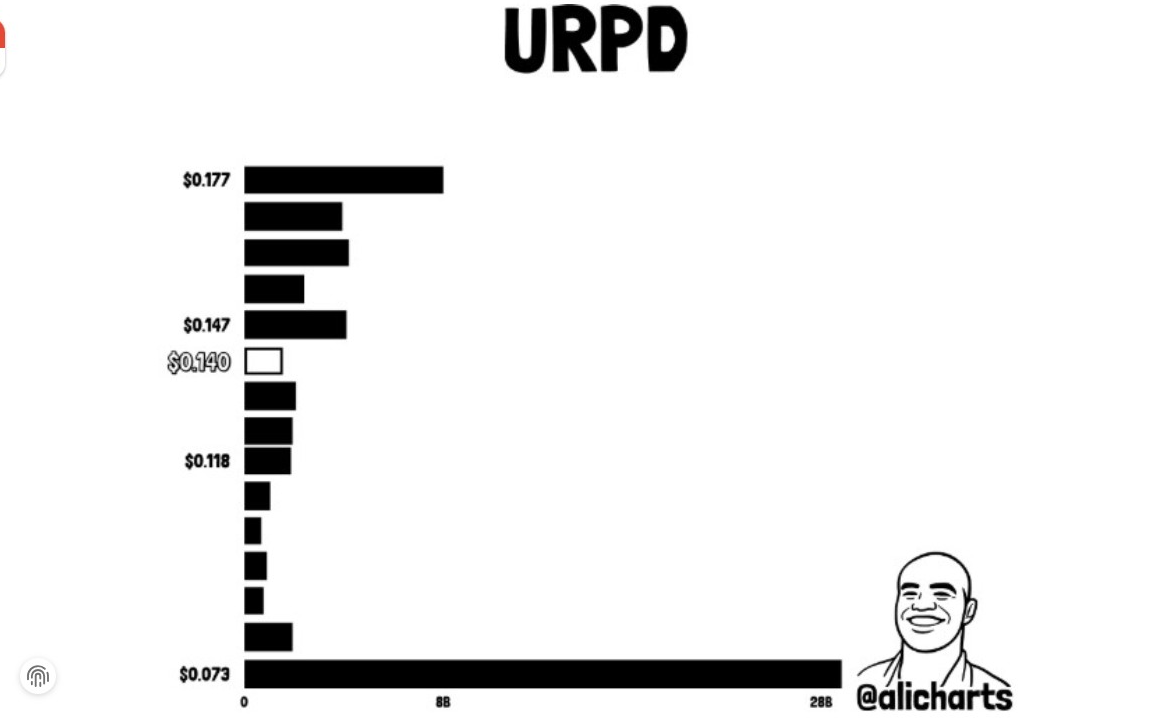
The distribution also suggests thinner positioning below $0.118. This can leave less “traffic” if the DOGE price slips into that region. In that setup, price can move more quickly between levels because fewer holders sit in the middle of the range.
Traders focus on how the Dogecoin price trends near the nearest support. The URPD view highlights this critical zone. The larger demand band becomes relevant only after this level is reached.
Dogecoin Price Forms Bullish Pennant as Traders Eye Breakout Toward $0.20
Trader Tardigrade’s chart shows Dogecoin price breaking above a descending trendline. The price then compresses into a bullish pennant, signaling potential continuation.
The structure formed after a sharp push from the low $0.12 area into the mid $0.15 region. Consolidation followed this.
Pennants require a breakout beyond the upper boundary to confirm continuation. The chart marks the decision zone between $0.15 and $0.155.
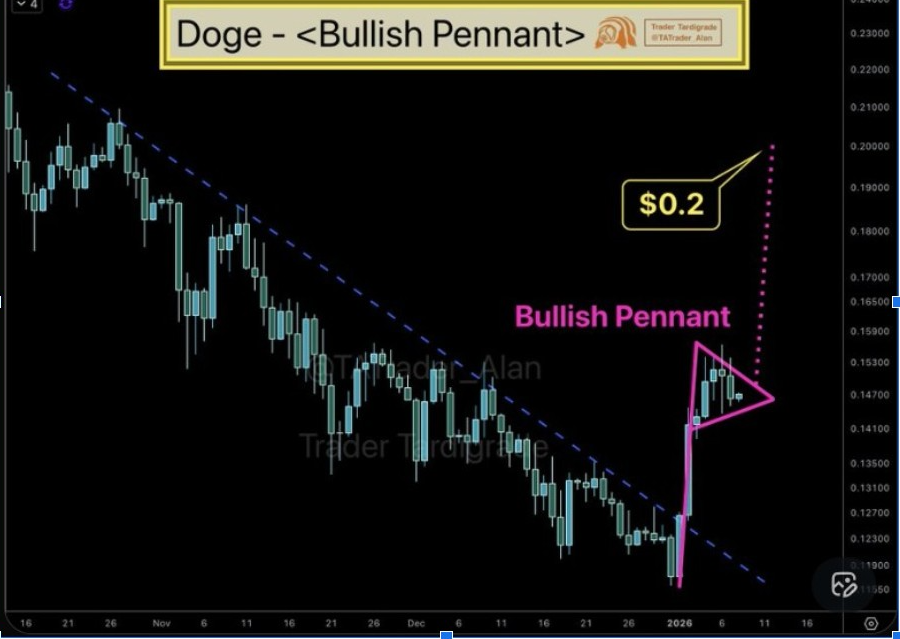
If DOGE price records a daily close above that band, traders confirm buyers regained control. They view the move as a clear signal after consolidation.
The next checkpoints sit around prior supply zones near $0.177. Traders set a measured objective at $0.20. If Dogecoin price breaks out but fails to hold on to a retest, the move loses strength. Price action then returns to range conditions.
Monthly Candles, Network Activity, and Supply Dynamics in 2026
Trader Tardigrade also pointed to a monthly “tweezer” style pattern, where consecutive candles print similar lows. To this, traders often read as evidence of defense at that level.
Early January showed a recovery attempt versus the prior month’s decline. This keeps attention on whether the monthly low remains protected.
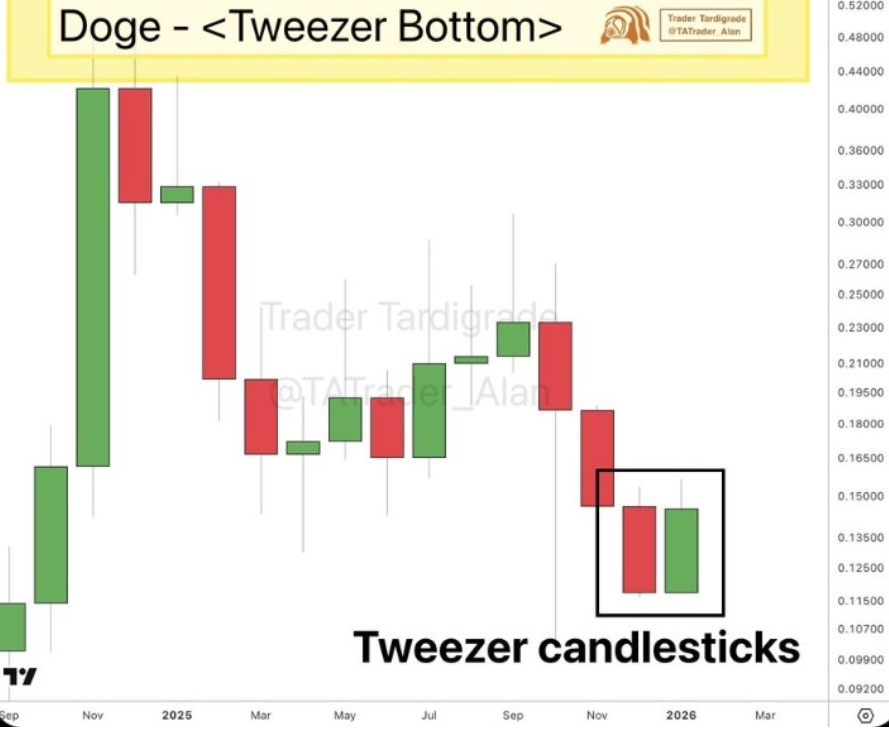
Even so, overhead supply remains visible on the chart around $0.15 to $0.16. It’s an area that repeatedly acted as a friction zone during recent trading.
Beyond chart structure, analysts continue to track DOGE’s supply design and activity trends. Dogecoin issues 10,000 DOGE per block, adding close to 5 billion new coins each year. This can increase sales pressure during weaker demand periods.
On-chain tracking also showed active Dogecoin addresses rising to about 71,589 near the end of 2025. This is a three-month high, which traders often monitor as a signal of continued engagement.


