
 Zylo Ecosystem
 astronaut
 Pearl
Pearl Walrus
 Starknet
 Pudgy Penguins
 Bitcoin

Dogecoin price has dropped dramatically in the past sessions. The token lost over 10% as technical indicators gave multiple bearish cues.
The short-term trend is negative. However, some analysts suggest the worst may have bottomed out due to key support and bullish divergence levels. This may initiate a possible recovery.
Traders watch closely as the DOGE price tests key technical zones. They monitor whether it can stabilize above these levels. They also track if the price continues to fall.
Bearish Ichimoku Signals Weigh on Dogecoin Price
Analyst Trader Tardigrade highlighted a series of bearish signals on the Dogecoin 4-hour Ichimoku chart that indicated a further downtrend.
DOGE was recently rejected at the Kijun-sen (Base Line) resistance, which triggered a short trade setup. After the rejection, the asset fell by over 10.8% from around $0.125 to a low of around $0.112.
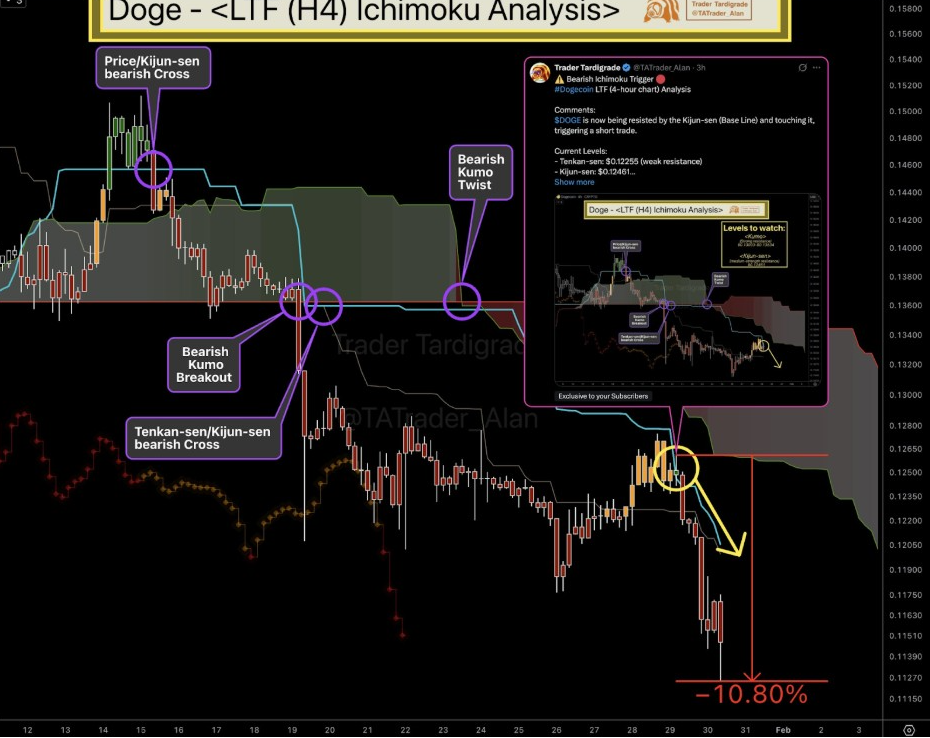
The Ichimoku chart showed a bearish Price / Kijun-sen cross, Tenkan-sen / Kijun-sen cross, and a bearish Kumo breakout. All of this confirmed a downward momentum. A bearish Kumo twist also formed, indicating that the current market structure remains unfavourable for bulls.
“DOGE is now under attack from Kijun-sen and touching it, triggering a short trade,” Tardigrade mentioned in his alert to followers.
The bearish setup signals a high risk of further downside. Dogecoin price faces this risk if it fails to hold its current support.
Traders watch to see if the price retakes the Kijun-sen. They look for a move back above the cloud. Such a move signals a potential trend reversal.
Monthly Chart Shows DOGE Holding Above Gaussian Channel
Despite short-term bearish action, the monthly chart is a much more resilient picture. According to Tardigrade’s Gaussian Channel analysis, the DOGE price has traded above the long-term Gaussian midline. This has historically provided dynamic support within a broader uptrend.
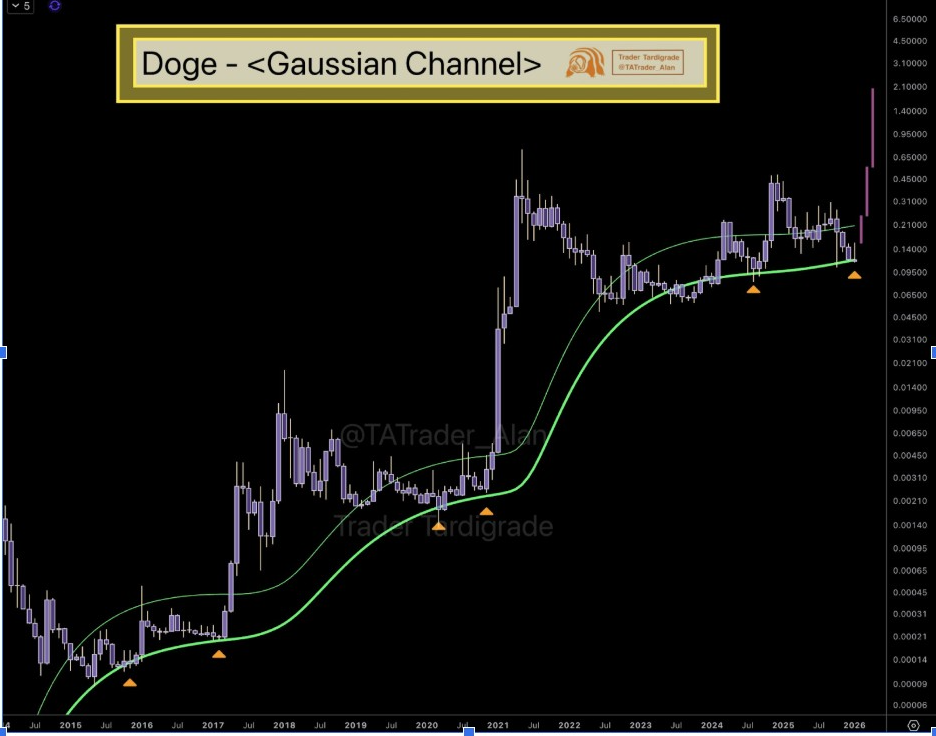
The Gaussian Channel indicator can be used to identify long-term directional trends. When prices remain above the midline, it usually helps validate a bullish structure. Also, when prices break below, it can confirm long-term weakness.
In the case of the Dogecoin price, the asset is holding just above the lower band of the channel. This indicates that although there is downside risk, the macro bullish trend is not completely null and void.
As long as the DOGE price stays above this level on the monthly chart, there may be long-term bulls in control.
Bullish Divergence Appears on RSI, Signalling Possible Rebound
Adding to the mixed signals is the appearance of bullish divergence on 4Hr RSI. According to Tardigrade’s analysis, Dogecoin has now printed a second consecutive bullish divergence, with price making lower lows.
However, the RSI makes higher lows. This pattern often signals fading bearishness. It can lead to a reversal in the trend, and may also trigger a short‑term bounce.
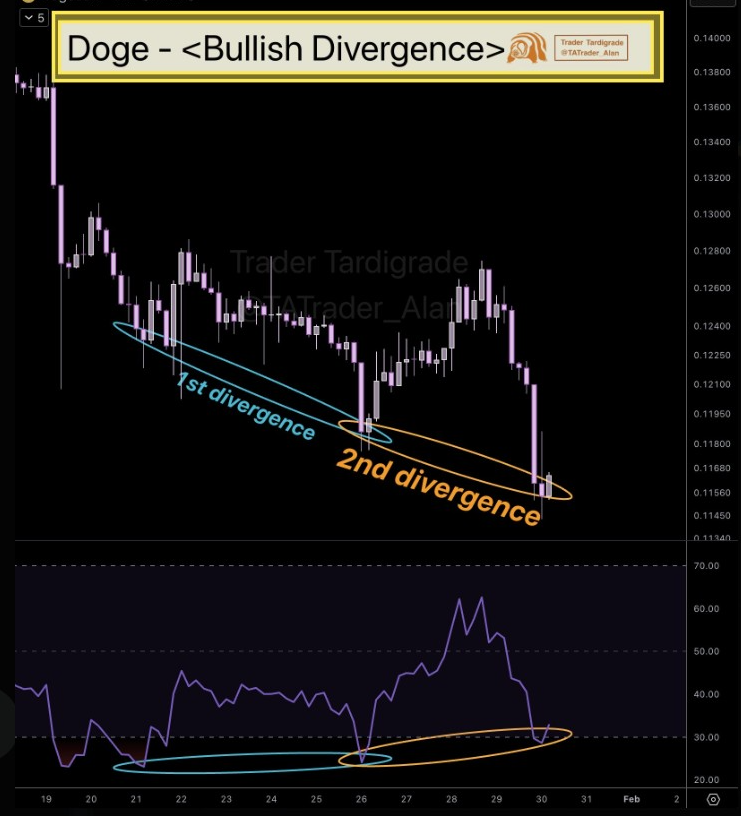
Divergence does not imply an immediate recovery. However, it indicates that the sellers might be losing momentum.
Provided that bulls will have an opportunity to take advantage of the signal and protect major supports at or below $0.112, it may be followed by a relief rally to $0.125 or beyond.
Analyst Crypt0Nova also highlighted a possible bullish structure forming. His chart had a successful retest of horizontal support and a breakout from a descending trendline. He said “Bullish structure loading,” implying that DOGE might be building a base for the next move higher.
Dogecoin Price Next Move Depends on Technical Zones
At press time, Dogecoin price was trading near $0.120 with less volatility. Traders are still split on the short-term outlook. Some consider the bearish Ichimoku signals dominant after the sharp rejection from the Kijun-sen.
Others are more focused on the developing bullish divergence and the monthly Gaussian Channel support.
DOGE price must reclaim the $0.124 range. It needs to close above that level on the daily timeframe. Doing so could start to dissipate the bearish bias. However, failure to hold $0.112 could open the door for further losses to $0.105 or less.



