
 Pearl
Pearl Walrus
 Bitway
 Bitcoin
 Quantus
 Quant
Quant Pudgy Penguins

Dogecoin (DOGE) price prediction is relevant, as several charts indicate a valid structural transition from correction and currently point at recovery. DOGE price just settled above the $0.10 zone as a result of a breakout and effective retest of the falling resistance. The closest supply hurdle noted by analysts is $0.117-$0.119, whereas the next target is $0.14 on the upside.
Dogecoin Price Prediction Strengthens After Trendline Retest
According to analyst Trader Tardigrade, the daily chart shows Dogecoin breaking above a persistent descending trendline. The structure previously defined weeks of lower highs and sustained bearish control.
Moreover, the breakout candle closed decisively above resistance, marking the first structural shift from distribution toward accumulation.
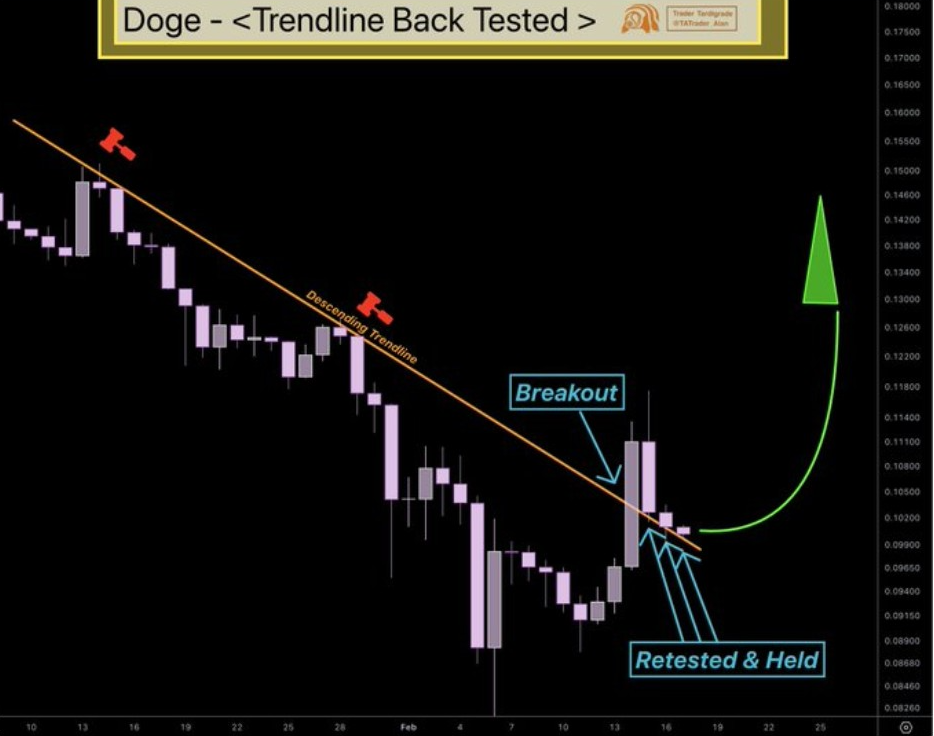
Following the breakout, price retraced to test the former trendline from above. The chart labels this event “Retested & Held,” confirming support conversion. Consolidation developed above the $0.10 zone, which suggests acceptance at higher levels rather than rejection. This sequence reflects a classic breakout and support validation pattern.
Momentum characteristics further support the reversal structure. Expanding bullish candles preceded the breakout, indicating that demand is strengthening into resistance. The absence of a deep rejection candle wick on the retest also suggests sellers have failed to regain control. Notably, the chart projects a continuation toward the $0.14 resistance band if support holds.
Rounded Bottom Supports Multi-Timeframe Recovery
In the meantime, analyst Cantonese Cat demonstrated on the 4-hour chart with a rounded-bottom structure under Dogecoin price. The post capitulation structure was formed around the level of the $0.078-$0.080 zone. Sloping curves and increased troughs are signs that there is a decrease in selling pressure and a gradual build-up in the memecoin market.
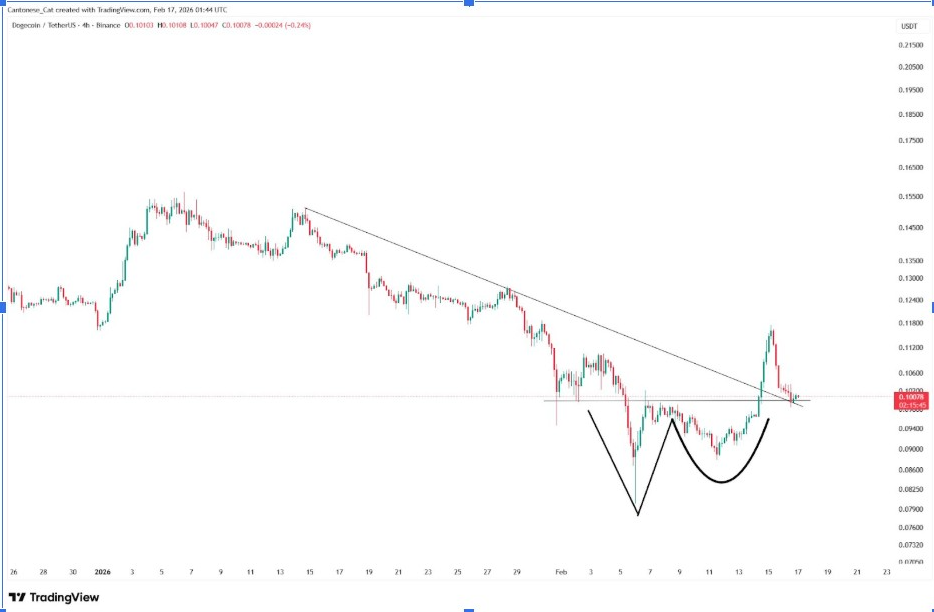
Dogecoin price initially shot off above descending resistance and was rejected near $0.118. This level corresponds to a previous horizontal opposition and convergence of the trendline. The rejection is an indication of the concentration of supply, logically, and not a structural failure. Pullback behavior was also calm, which implied profit-taking and not a renewed distribution pressure.
Currently, DOGE price is consolidating near the $0.10 equilibrium zone. This level is a pivot that separates continuation from deeper retracement. Reclaiming and holding above descending resistance would align with the daily breakout structure. Failure below $0.098 could weaken the rounded-bottom framework.
Consolidation Structure Reinforces $0.10 Support Base
Separately, a 4-hour perpetual futures chart shows that Dogecoin price stabilized following rejection around $0.119. In a clear impulsive move, the meme price had earlier moved out of the $0.079-$0.080 swing low. There were higher highs and higher lows on the trendline on an upward trajectory, which is a confirmation of bullish short-term structure.
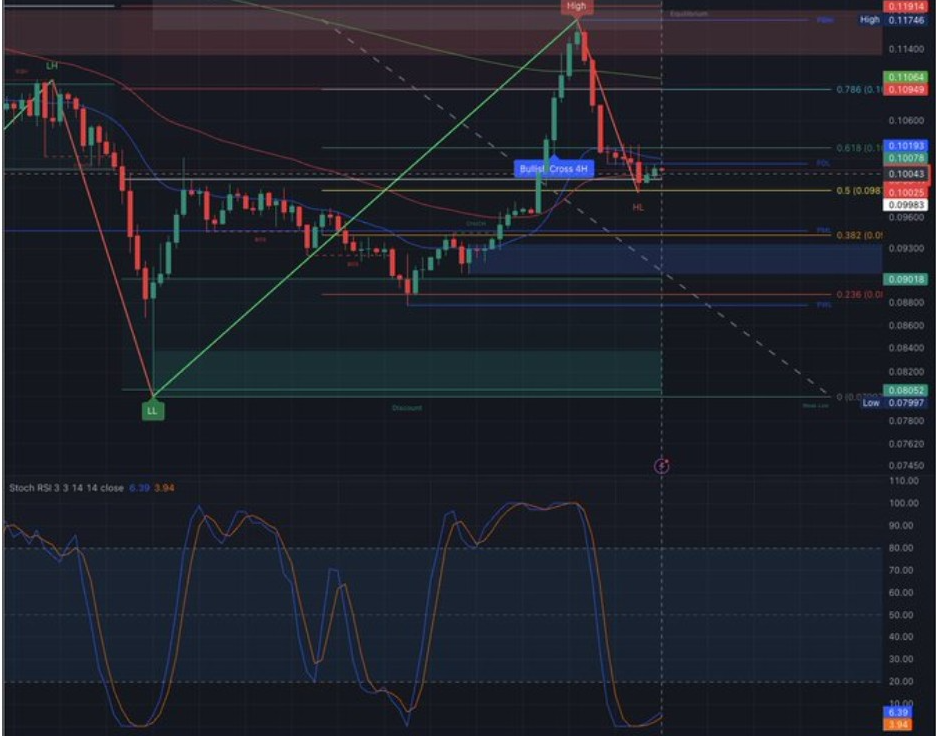
Following the rejection, DOGE price reverted to a Fibonacci confluence zone of $0.100. This zone coincides with horizontal support and a moving-average crossover cluster. Currently, the asset is consolidating amid minimized volatility, with directional expansion usually preceded by such phases of balance.
In addition, market structure remains constructive while price holds above $0.098. This zone represents the latest higher-low formation within the recovery sequence. A renewed move above $0.110 could trigger another test of the $0.119 resistance. Also, a breakout continuation would place the $0.13 level as the next technical objective.
Moreover, momentum indicators strengthen stabilization conditions at lower time intervals. Additionally, overbought oscillators have turned into neutral positions. This reset helps in possible continuation when the structural support has not been destroyed. On the other hand, any loss of $0.098 would reveal further retracement levels around $0.091 and $0.082.


