
 Pearl
Pearl Zylo Ecosystem
 Bitway
 Derive
 Walrus
 Quantus
 Pudgy Penguins

Ethereum is moving into a more defined technical zone as exchange outflows and breakout pressure begin to align. Recent charts place immediate focus on the $2,400 resistance band, while analysts map a possible move toward $2,800 if that barrier gives way. At the same time, more than 336,000 ETH have reportedly left exchanges in the past week. This adds a supply-side dimension to the current setup.
Ethereum Price Tightens as Exchange Supply Declines
According to Ali Charts, centralized exchange balances have fallen steadily over the past week. The chart shows reserves dropping from about 14.6 million ETH to roughly 14.3 million ETH. That decline reflects more than 336,000 ETH leaving exchanges during the period.
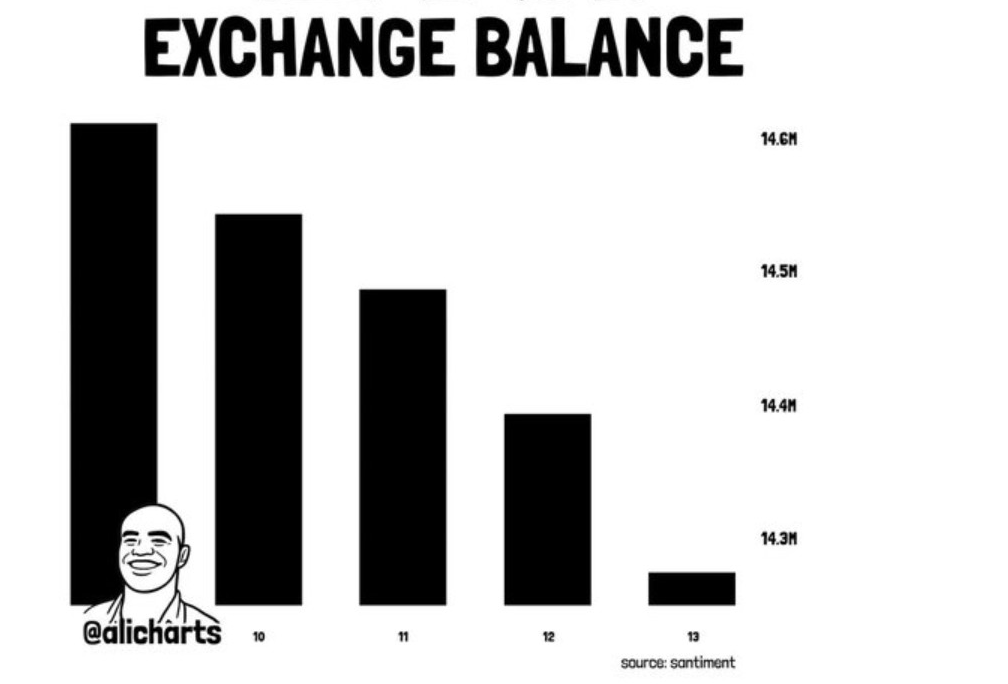
When coins move off exchanges, traders usually read it as a sign of longer holding behavior. Assets shifted into private wallets or staking platforms are less available for immediate sale. That can tighten the liquid supply during periods of price recovery. Ethereum price is attempting to build upward momentum while exchange balances continue to fall.
Additionally, the timing of the withdrawals matters. The outflows are happening as ETH crypto tries to recover from a prolonged consolidation phase. That combination can strengthen the supply backdrop if demand remains firm. A declining exchange balance does not guarantee a rally, but it can support market stability when buying pressure returns.
Ethereum Price Tests $2,400 Breakout Barrier
Ash Crypto’s chart turns the focus to price action on the daily timeframe. ETH crypto has been forming higher lows while pressing into a diagonal resistance line near the $2,300 zone. That pattern often reflects growing pressure beneath a ceiling. In this case, Ethereum price is approaching a level that could decide whether consolidation shifts into expansion.
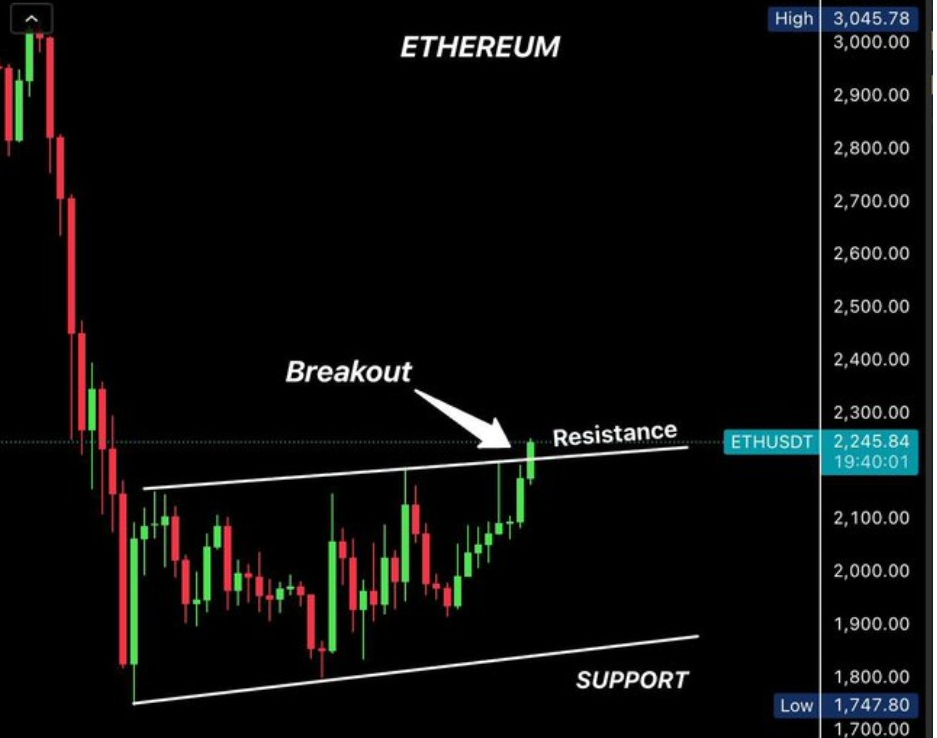
According to the chart, $2,400 is the trigger level that needs to be broken. A confirmed move above that zone would suggest buyers have absorbed near-term selling pressure. If that happens, the next projected move points toward the $2,800 zone. That makes the resistance band the main technical checkpoint in the current ETH price structure.
Another notable feature is the rising support trendline beneath the price. Buyers have been stepping in at progressively higher levels, creating a sequence of higher lows. That usually signals improving market control from the demand side. When this kind of support meets horizontal or diagonal resistance, a breakout often becomes the central market event.
Furthermore, the setup remains conditional until the resistance is cleared. ETH crypto can still stall beneath $2,400 if selling pressure returns in the same zone.
CME Gaps Place $2,641 and $3,200 in Focus
CW’s chart adds a futures-market layer through CME gap analysis. The analyst notes that Ethereum has already filled the first gap in the present structure. Once that imbalance was closed, attention shifted to the next open zone. According to the chart, the next CME gap sits near $2,641, with another one around $3,200.
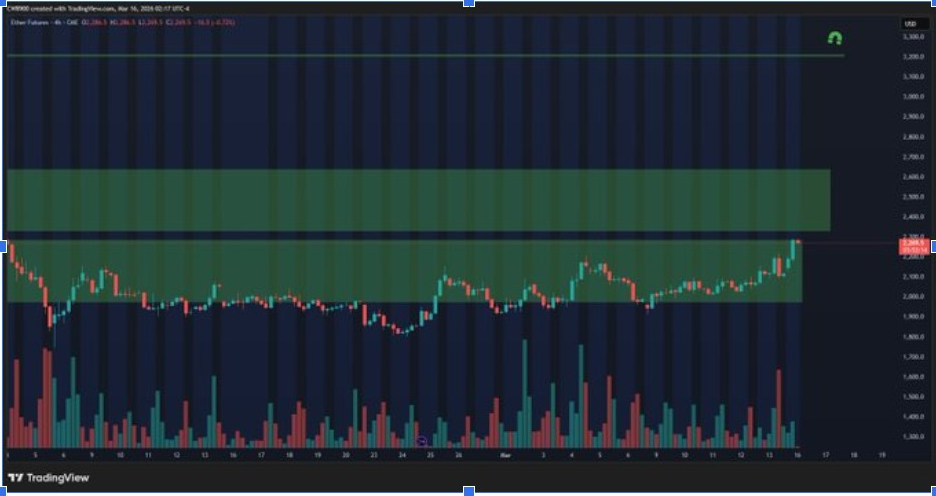
CME gaps are watched because crypto often trades through weekends while the futures market pauses. That can leave visible price gaps that traders later track as magnets for future movement. In this case, the filled first gap clears the way for the next upside reference. That gives the Ethereum price a more structured set of technical targets if momentum continues.
Additionally, the $2,641 level matters because it sits above the $2,400 breakout threshold. Should Ethereum price break out convincingly, the CME gap will likely be the next key area to watch. Further, if momentum persists, the $3,200 gap becomes a possible target.



