
 astronaut
 Zylo Ecosystem
 Pearl
Pearl Sui
Sui Walrus
 Quantus
 Quant
Quant

Ethereum price is stabilizing near the $2,000 zone after a sharp multi-week decline from above $3,000. The recent rebound from historical demand has shifted attention toward recovery scenarios.
Analysts have analyzed whether the current structure supports a broader Ethereum price prediction targeting the $6,000 level. ETH price remains below key resistance, keeping the continuation scenario intact.
Ethereum Price Tests $1,900 After Key Breakdown
According to Ted, the daily Ethereum chart exhibits a decisive breakdown from the demand zone of $2,800. This zone was also used as a consolidation point before the previous growth.
If the price breaks this support, downside momentum will be strong. The retracement attests to a structural change of lower highs and lower lows.
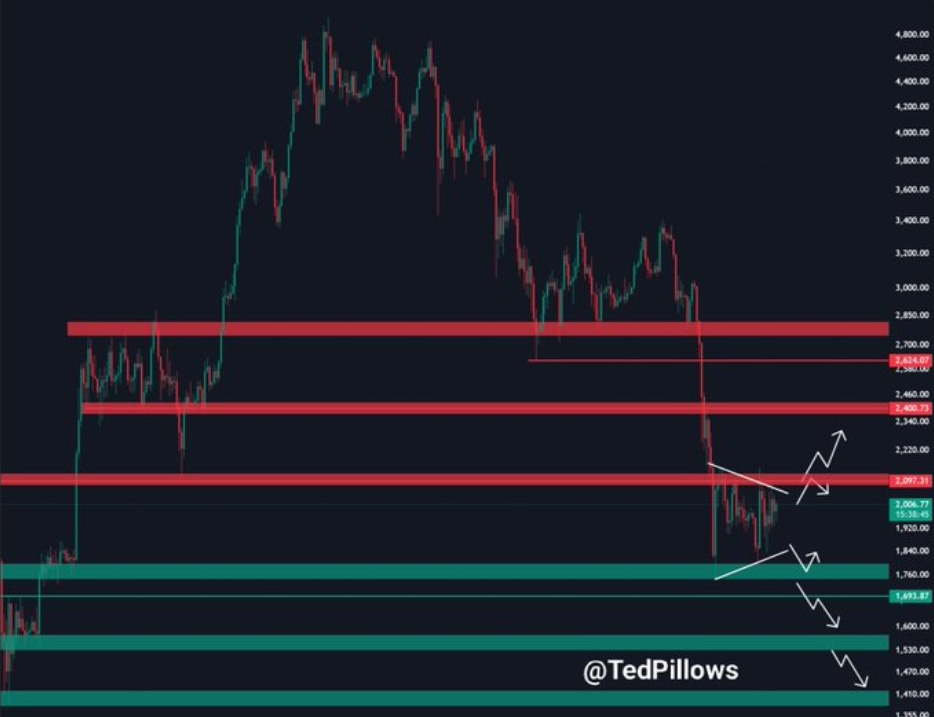
Additionally, the selloff went into the $2,000 support zone, where Ethereum price gave a reactive bounce. This zone corresponds to past demand and triggered a short-term interest in buying.
Nevertheless, the recovery is still corrective. ETH price remains under the previous $2,400 support zone, which now serves as immediate resistance.
The chart highlights prior liquidity clusters swept during the decline. These clusters indicate buyers’ activation beneath previous consolidation ranges.
Current consolidation above $1,900 suggests temporary stabilization rather than a confirmed reversal. A strong reclaim of $2,200 is required to shift the daily structure positively.
There are two main directions for Ethereum price prediction that Ted noted. The possibility of a relief rally to $2,200 before a second wave of the sell side.
Alternatively, any lack of strong support may expose the downside to the range of $1,600. Until the reclaimed resistance is achieved, the daily bias remains cautious.
Ethereum Price Prediction Eyes $6K Channel
Meanwhile, Trader Tardigrade presented a broader weekly view using a long-term ascending channel. Ethereum has maintained this channel structure since forming a local bottom near $1,565.
Every preceding cycle had bounced back from the lower level and then progressed to the upper resistance. This framework positions the macro Ethereum price prediction perspective positively.
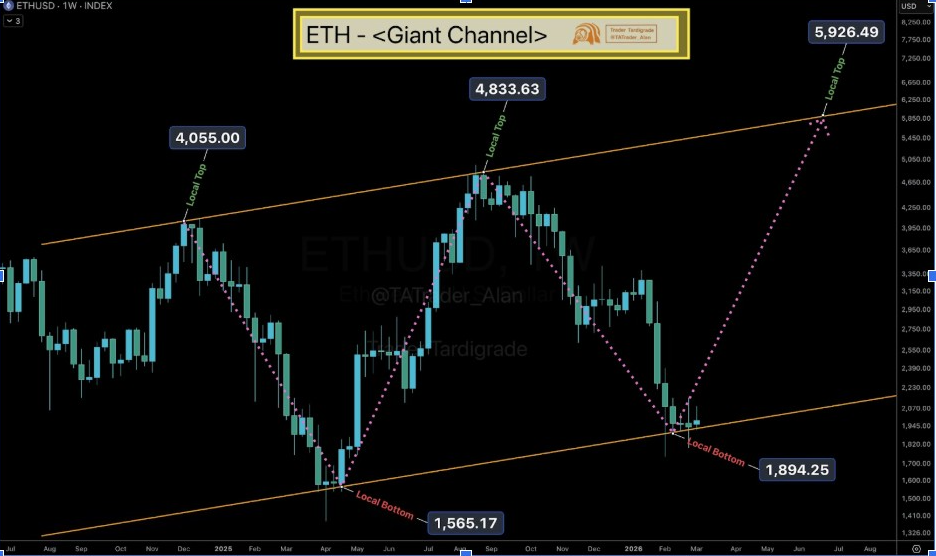
Moreover, the recent correction to $1,894 is consistent with the bottom trendline of the channel. This retest is a reflection of the previous cycle behavior within the structure.
In the past, such drawbacks were followed by price surges. The trajectory projects a potential rotation toward $6,000 if the pattern is sustained.
In addition, previous cycle peaks around the $4,055 and $4,833 levels are indicated within the channel. Each top was followed by a measured pullback toward support before continuation.
The expanding swings indicate the cyclic volatility growth of Ethereum. The macro trend is technically intact, provided that the bottom line is not crossed.
Weekly closing below channel support would nullify the structure. However, repeated defense of this region strengthens the base formation argument.
Within this context, the ETH price rebound from $1,900 becomes structurally significant. The channel continues guiding long-term Ethereum price prediction models.
Ethereum Price Prediction: Imminent ETH Breakout?
James Easton focused on lower timeframe compression. Ethereum price has been fluctuating in a symmetrical triangle that is outlined by the falling resistance and rising support.
This trend is an indicator of the contraction of volatility and market indecision. These structures often lead to breakouts.
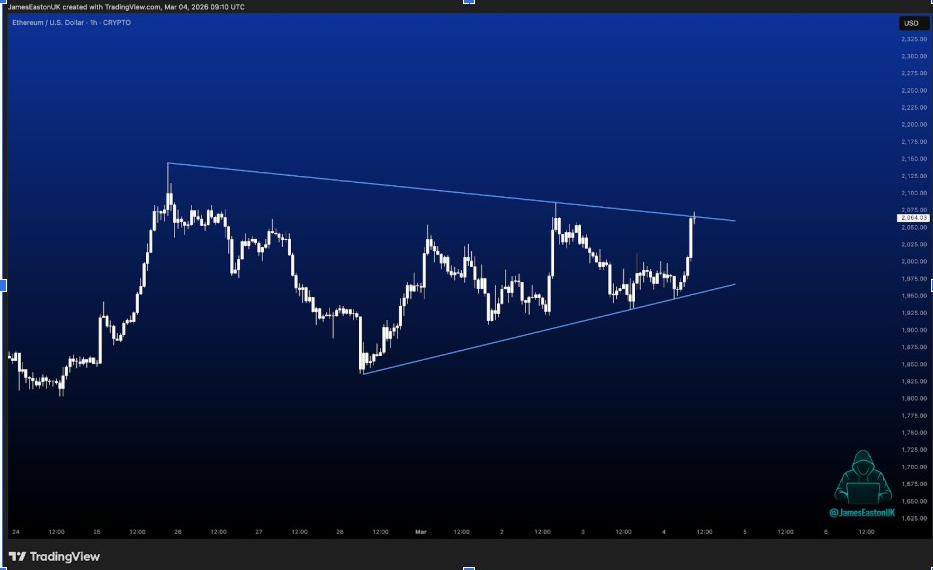
More so, ETH price has respected both trendlines multiple times. Lower highs were established along the upper line, and the higher lows formed at the bottom.
The triangle is directly positioned above the local demand zone that is shown on a higher timeframe. This congruency enhances the importance of the existing consolidation.
A short-term rally may be caused by a breakout above descending resistance. The first upside targets will be around the levels of $2,200, which serves as previous resistance.
Reclaiming this zone would help to make a positive short-term Ethereum price prediction. The breakout validity would be strengthened by volume confirmation.
On the other hand, failure of the rising support might increase the downward pressure. Such a move would reveal more liquidity in the $1,700 zone.
Volatility expansion seems imminent with the range narrowing. The direction of the breakout will determine whether this rebound evolves into a broader structural recovery.




