Dacity Coin
 Zcash
Zcash Celestia
 Bitcoin
 Pearl
Pearl Injective
 Pons
Pons

Bitcoin is currently hovering around $68,500, with traders keeping a close eye on crucial structural levels spanning various timeframes. The price of Bitcoin recently bounced back from the $60,000 area, maintaining a long-term ascending channel that has characterized macro cycles since 2017.
Analysts are now determining if this structure is conducive to Bitcoin price prediction, potentially reaching $170,000 or beyond. A short-term resistance level near $70,000 presents the immediate hurdle before any significant upward movement.
9-Year Channel Supports Bitcoin Price Prediction
Trader Tardigrade showed Bitcoin trading in a 9-year rising pattern on the monthly chart. The structure has been holding price action since 2017, with every bear market low bouncing off the bottom boundary. Historical bull peaks extended above the upper channel line during rallies.
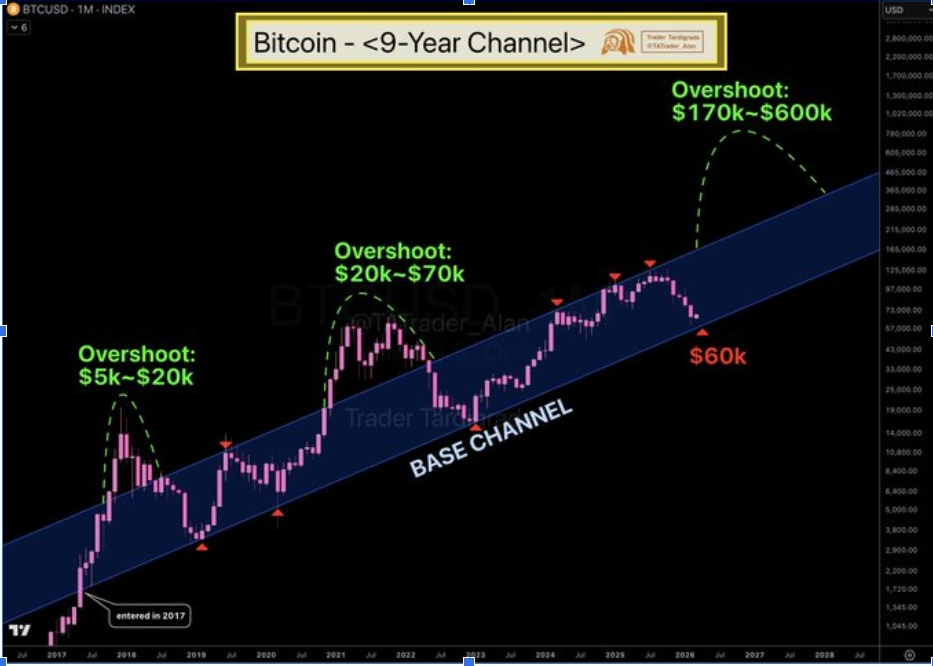
The channel’s lower boundary coincided with the recent decline towards $60,000. This zone also coincides with prior structural support from earlier consolidation zones. Historically, similar retests have preceded strong upward impulses. The fact that BTC price remains inside the channel supports the macro bullish framework.
Most importantly, prior cycles produced significant overshoot ranges. The 2017 cycle expanded beyond the channel from $5,000 to $20,000. The 2021 cycle extended from $20,000 to $70,000 during its rally phase. Based on proportional expansion, the current Bitcoin price prediction points to a potential rally to $170,000-$600,000.
Structurally, as long as monthly support is in place, the bias will be valid. Any close below the channel’s lower end would nullify the trend. However, respect for this framework supports the general uptrend bias. In addition, the growing amplitude across cycles indicates that historical volatility has expanded during late bull markets.
EMA Retest Supports BTC Price Structure
Meanwhile, Dami-Defi focused on the weekly 50-period Exponential Moving Average. This moving average has been the dynamic support for Bitcoin price in bull markets. The price has fallen below the EMA before, only to rise again.
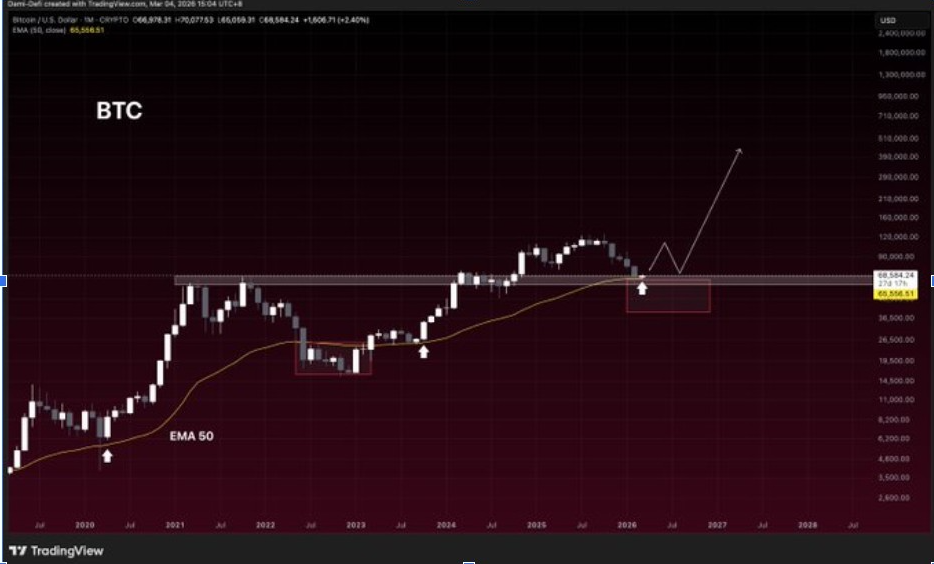
The chart indicates recurring liquidity sweeps below the equal lows near support. These sweeps would push the BTC price below $65,000 before it recovered shortly after. This indicates stop-loss hunts instead of longer-term breakdowns. The repeated reclaims imply accumulation in the range.
However, there is still an upper limit to the rallies. Several rejections suggest active supply in the zone. A breakout strongly above resistance, particularly with high volume, would be a possible start of an expansion to greater liquidity clusters. This would help enhance short-term upside momentum.
On the other hand, the inability to defend the $65,000 level may trigger another pullback. Compression has taken over price action in the established range. The next stage of volatility may depend on liquidity concentration around the range of $70,000.