
 astronaut
 Zylo Ecosystem
 Pearl
Pearl Quantus
 Bitcoin
 Sui
Sui Bitway

Ethereum price showed a brief institutional demand surge before cooling this week. Data showed Coinbase demand peaked, then weakened as buying momentum slowed. The move followed a short burst of United States-based accumulation that faded quickly.
The broader Ethereum price structure reflected mixed signals across spot and derivatives data. Institutional flows pushed prices higher first, but that strength failed to hold. That reaction mirrored past cycles where demand spikes reversed within days.
Ethereum Price Premium Surge And Quick Pullback
Arab Chain data showed Ethereum traded at a premium on Coinbase, reaching 0.055 before dropping to 0.006. The spike marked the highest premium level since Oct. 2025, signaling strong institutional inflows. The decline followed as the price gap between Coinbase and Binance narrowed, indicating reduced buying pressure.
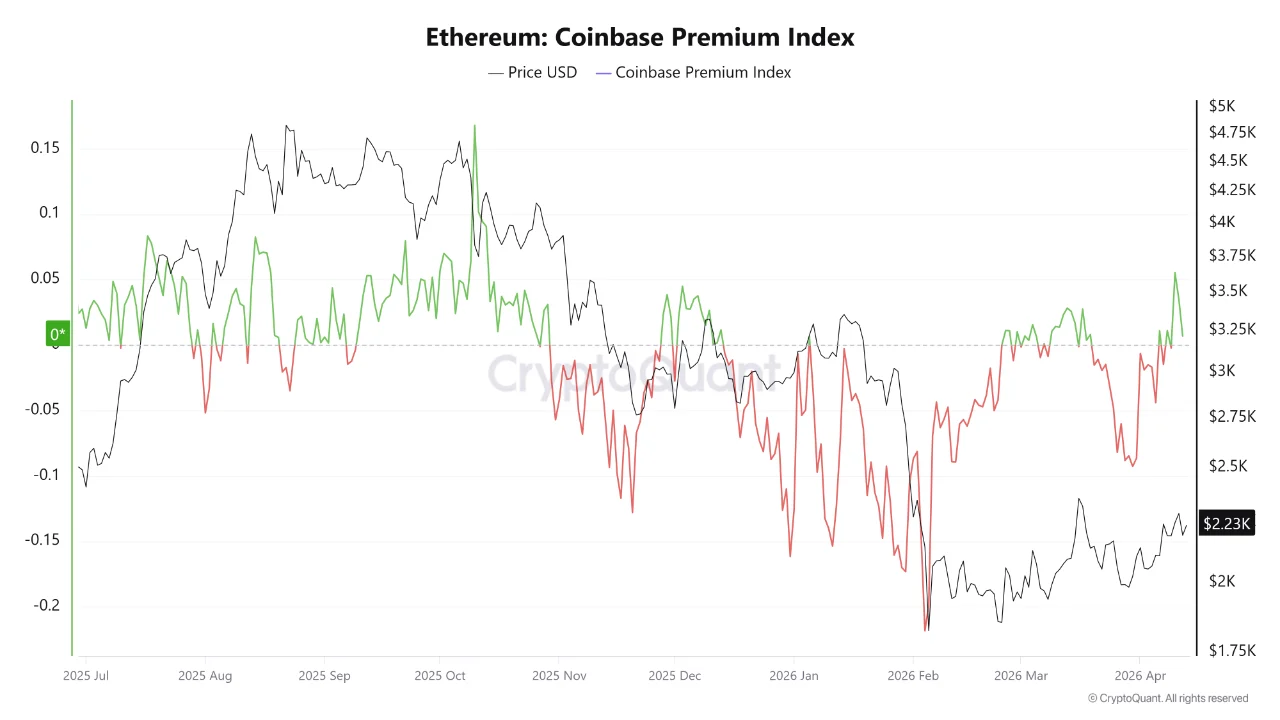
This shift occurred because initial demand came from U.S.-based investors seeking exposure during short-term momentum. Once that demand eased, arbitrage activity quickly reduced the premium. The fading spread suggested institutions paused aggressive accumulation after the initial push.
Market behavior showed that premium spikes often act as short-lived sentiment indicators rather than sustained trend drivers. Similar patterns appeared in previous cycles, in which sharp demand bursts failed to extend rallies. The latest move fit that structure closely.
Ethereum Price Structure Shows Weak Momentum Signals
Lookonchain data showed Bit Digital staked 73,234 ETH over the past week, valued at $156.64M. The accumulation suggested long-term positioning, even as short-term demand cooled. Staking reduced liquid supply, which typically supports price stability during weak spot demand phases.
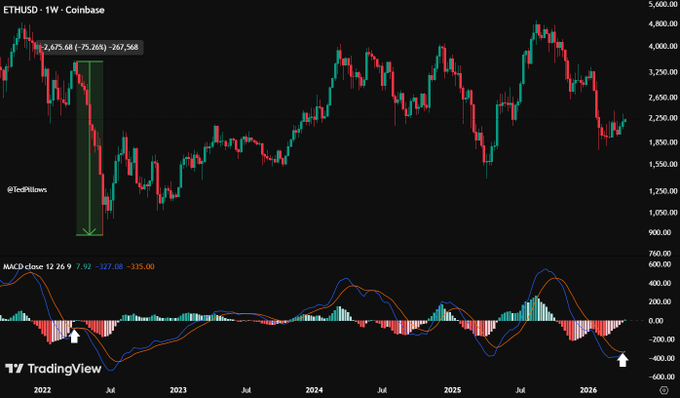
However, Ted Pillows analysis showed a MACD bullish cross formed during a downtrend. Historical data from 2022 showed similar signals marked local tops rather than trend reversals. The indicator suggested that the Ethereum price rally lacked strong continuation.
Chart structure aligned with this view. Price action formed a contracting pattern after a sharp drop, with lower highs limiting upside attempts. Buyers attempted to recover, but resistance zones quickly rejected each breakout attempt.
The combination of staking activity and weak momentum created a conflicting setup. Long-term holders increased exposure, while short-term traders reduced risk. That divergence kept Ethereum price within a compressed range.
Ethereum Price Faces Pressure From Structural Resistance
TradingView data showed Ethereum remained below a descending trendline that started after its earlier peak. The asset attempted multiple breakouts but failed to sustain moves above resistance. Each rejection reinforced the broader downtrend structure.
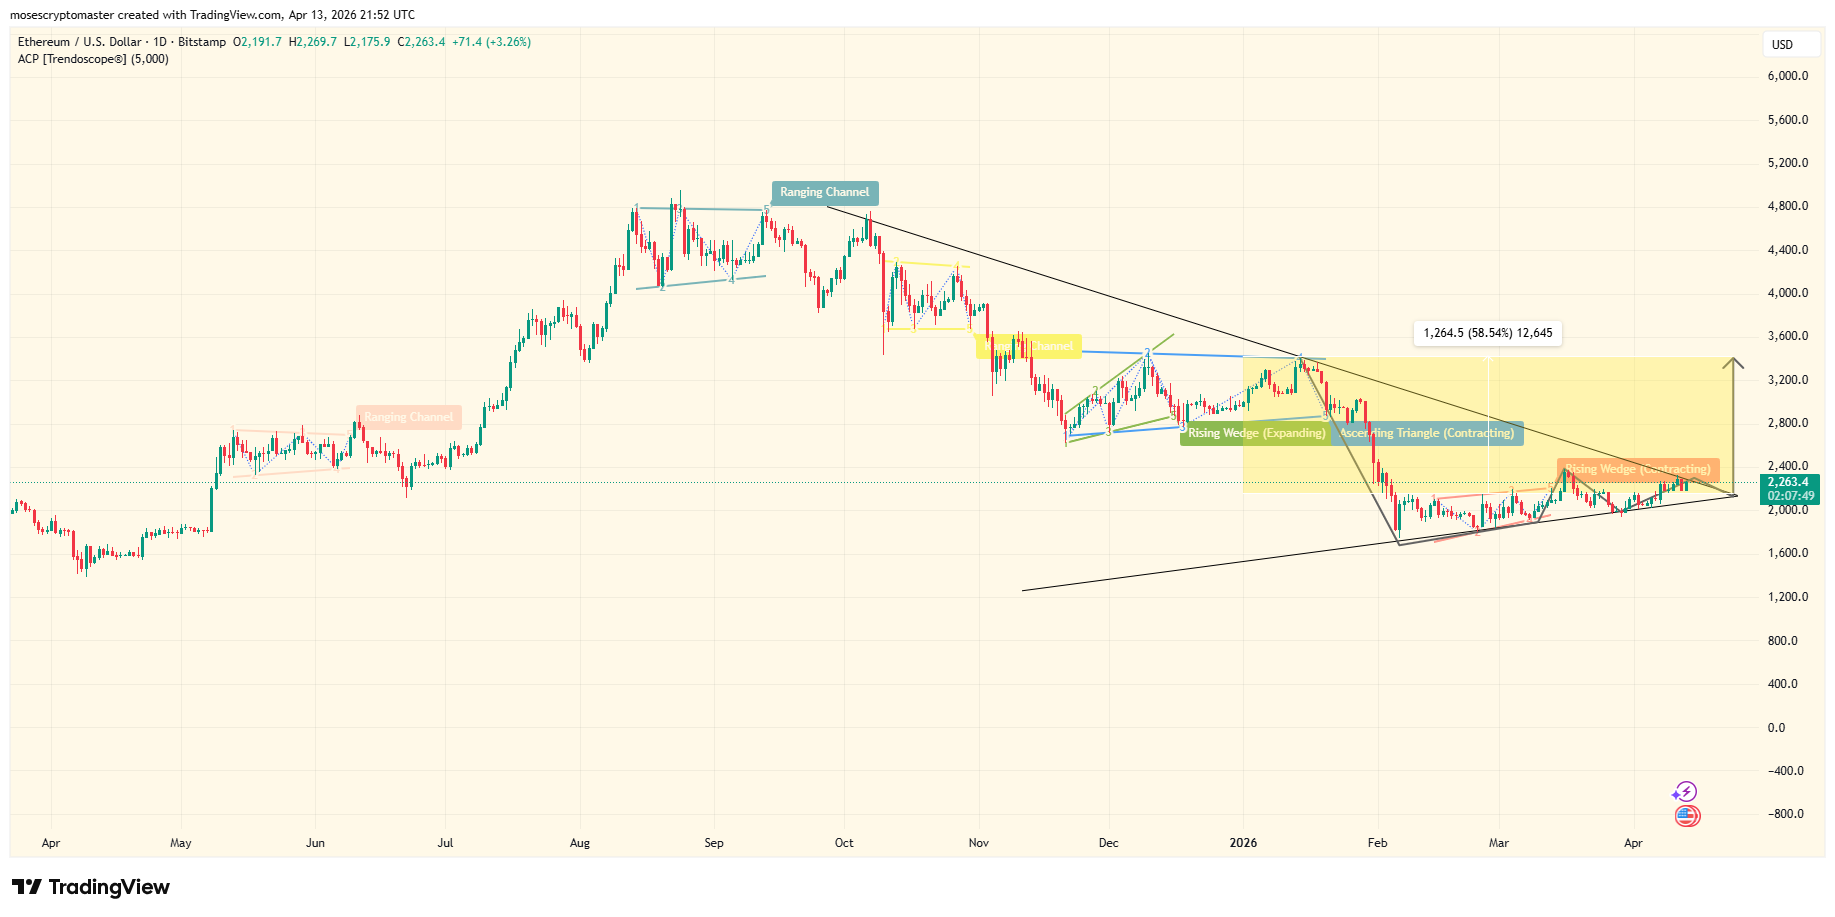
The recent consolidation formed near the lower boundary of a rising support line. This created a tightening range, suggesting an imminent breakout attempt. However, resistance remained dominant due to repeated failed rallies.
That pattern resembled a contracting wedge, which often precedes volatility expansion. Market participants watched for direction, as both breakout and breakdown scenarios remained open. The lack of strong volume supported the idea of indecision.
Institutional demand alone failed to shift the structure. Even with premium spikes and staking activity, price action stayed constrained. This suggested broader macro or liquidity conditions limited upside momentum.
Ethereum price now traded near the apex of its consolidation range, where decisions typically accelerate. The next move depended on whether buyers reclaimed trendline resistance or sellers pushed below support.
Ethereum price faces immediate resistance near $2,400 and support near $2,000. A break above resistance could trigger a move toward $3,200, while a drop below support may extend losses toward $1,600.




