
 Pearl
Pearl Bitway
 NEAR Protocol
 Sui
Sui Pudgy Penguins
 Starknet
 Pons
Pons

Bitcoin price dropped to $77,500 on Apr. 27 after a rapid wave of liquidations hit derivatives markets. Data from Coin Bureau showed over $68 million in long positions were wiped out within one hour.
The move erased $41 billion from the total crypto market cap, with Bitcoin alone losing $27 billion. No clear macro or news catalyst explained the sudden decline.
The broader context showed Bitcoin (BTC) price struggling near resistance after a steady recovery phase. Momentum had built toward the $80,000 region, but derivatives activity disrupted the trend.
Traders faced aggressive selling pressure as leveraged positions unwound quickly. This shift occurred because crowded positioning left the market exposed to forced liquidations.
Bitcoin Price Faces Derivatives-Led Sell Pressure
Darkfost data showed Binance recorded roughly $1.2 billion in sell volume within a single hour. Across exchanges, total selling pressure reached $1.35 billion during that same period.
The move followed Bitcoin’s approach toward resistance, where liquidity clusters often trigger reversals. Funding rates remained deeply negative, reflecting sustained short positioning across derivatives markets.
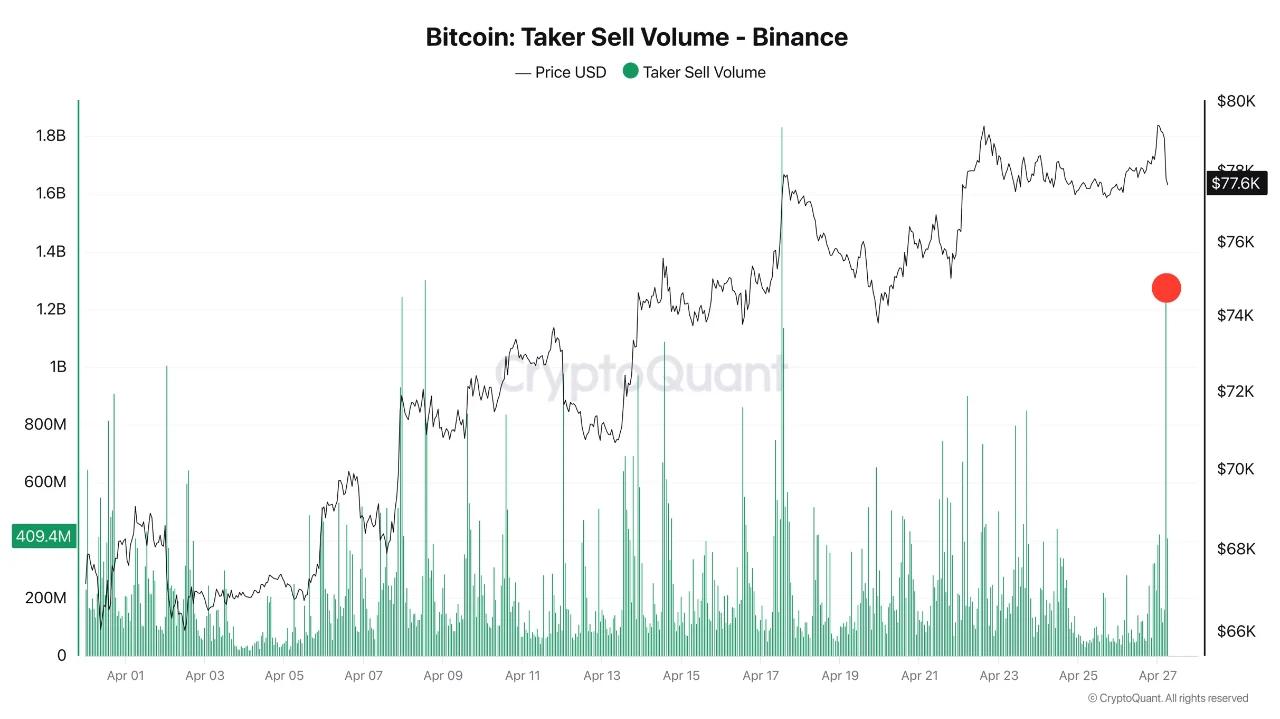
Coin Bureau data indicated the liquidation cascade accelerated the decline once key levels broke. Long traders faced forced exits, which added to the downward pressure.
This reaction mirrored previous volatility spikes where derivatives dominated short-term price action. The absence of spot-driven demand left the market vulnerable to rapid swings.
Bitcoin Price Technical Structure Tests Critical Zones
Michaël van de Poppe analysis showed Bitcoin price needed a breakout above $79,000 to confirm bullish continuation. He noted failure at that level could lead to consolidation or downside pressure.
The analyst identified $73,500 as a key support zone that needed to hold. A break below that threshold would open the path toward retesting lower levels.
TradingView data reflected a broader pattern of lower highs after rejection near resistance. The structure showed Bitcoin forming short-term channels within a wider corrective phase.
This pattern indicated uncertainty, with buyers unable to sustain upward momentum. The move followed repeated rejections that weakened bullish control over the trend.
Daan Crypto Trades observations linked current price behavior to historical macro-driven cycles. He noted similar timing patterns between past geopolitical events and Bitcoin drawdowns.
In earlier cycles, price declined sharply before stabilizing and rebounding. However, he pointed out that current macro conditions differ from previous tightening cycles.
Bitcoin Price Structure Shows Institutional Absorption
GugaOnChain analysis suggested Bitcoin price held above its realized price during recent volatility. The data showed institutional investors maintained positions despite derivatives-driven panic. This behavior differed from previous cycles where capitulation pushed prices below cost basis levels.
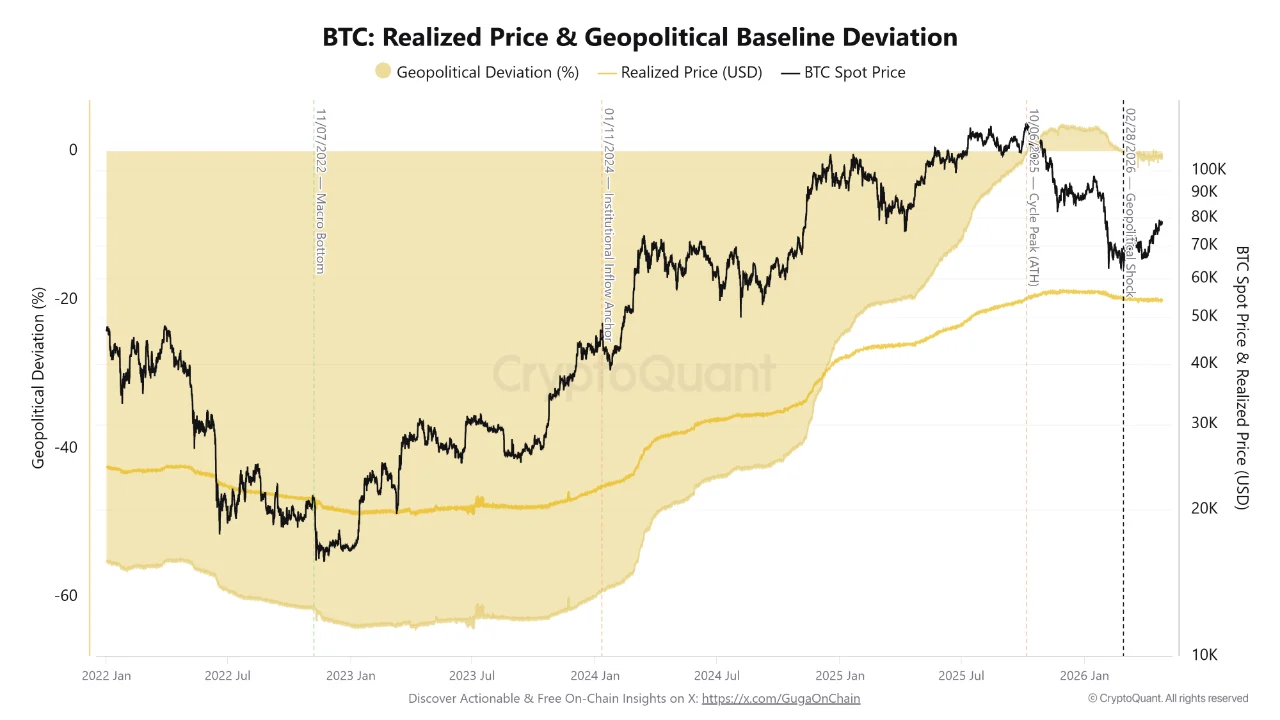
On-chain metrics indicated a shift toward accumulation rather than broad liquidation. Exchange reserve data showed a drop of 44,000 BTC from Binance following recent volatility.
This trend suggested large holders moved assets off exchanges, reducing immediate selling pressure. The reaction mirrored a pattern where long-term holders absorb supply during market stress.
The analysis described the recent phase as tactical de-risking rather than full capitulation. Retail traders exited positions during sharp declines, while larger players accumulated at lower levels. This shift occurred because institutional conviction remained intact despite short-term volatility.
Outlook For Bitcoin Price After Flash Crash
Bitcoin price now faced a near-term test around the $79,000 resistance level, where prior rejection occurred. A sustained move above that zone could restore bullish momentum toward higher targets.
Failure to reclaim that level would likely extend consolidation or trigger another downside test near $73,500 support.




