
 Zylo Ecosystem
 astronaut
 Pearl
Pearl Walrus
 Starknet
 Pudgy Penguins
 Bitcoin

Bitcoin price traded near $77,300 on Sept. 12 after its latest recovery stalled below $80,000. BTC briefly approached $79,700 on Sept. 11 before sellers pushed it back toward a major weekly support area.
Several resistance levels now sit between $81,700 and $88,700. Meanwhile, technical and on-chain data place major downside support between $62,000 and $70,000 if Bitcoin loses its current range.
Bitcoin Price Holds Near the 50-Week EMA
Bitcoin price traded near $77,500 after failing to hold its push toward $80,000. Analyst Ted noted that this area lines up with the 50-week EMA. BTC crypto price prediction places the average near $77,413, while the 50-week simple moving average sits near $79,675.
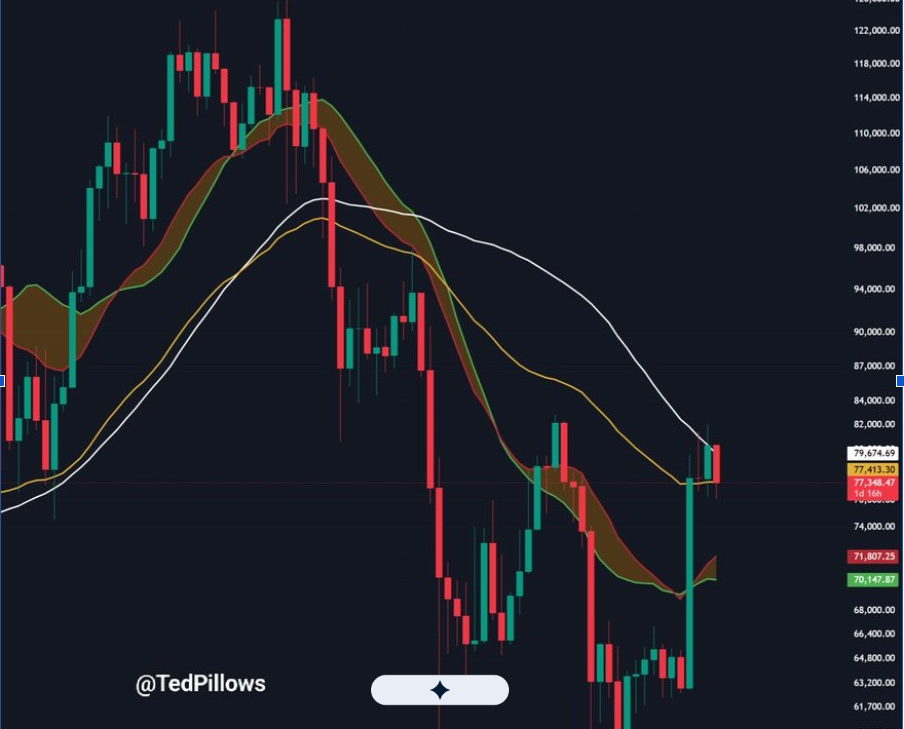
A break below $77,000 would weaken the current Bitcoin price support test. The same outlook identifies $72,000 to $73,000 as the next downside area under that scenario. Bitcoin also sits above a broader support band near $70,000 to $71,800 on the weekly chart. That zone includes the bull-market support band tracked in the analysis.
BTC Crypto $81.7K to $87K Forms a Resistance Area
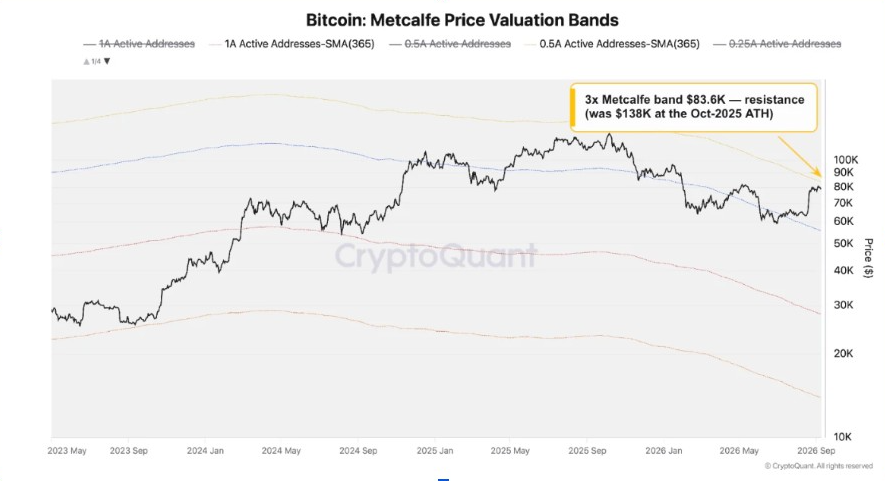
CryptoQuant data places Bitcoin’s 365-day moving average near $81,700. The firm treats that level as the first major barrier above spot price. A second valuation level sits near $83,600 on the 3x Metcalfe band. Bitcoin price would need to clear both areas to extend the recovery.
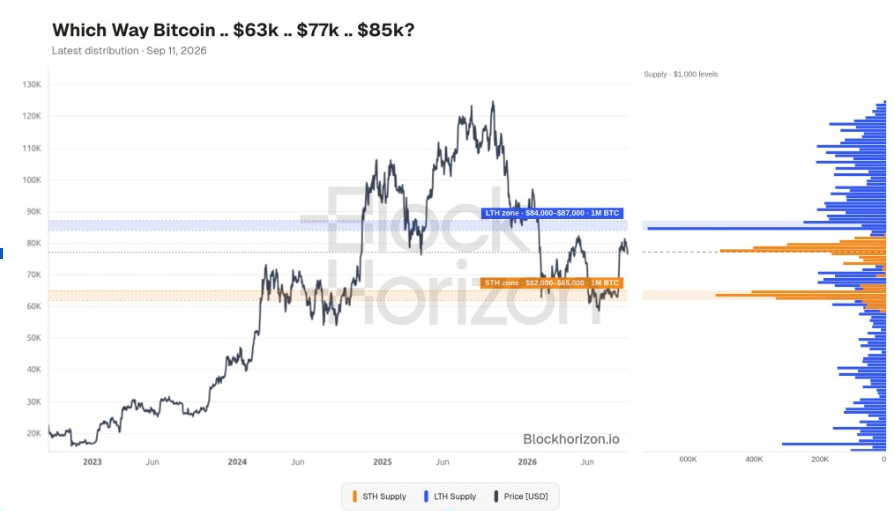
On-chain supply adds another obstacle. BlockHorizon data shows about one million BTC concentrated between $84,000 and $87,000 among long-term holders. A separate CryptoQuant estimate identifies heavy supply between $77,100 and $80,200. Long-term holders sold up to 539,000 BTC during 30 days in 2026.
That concentration places several resistance measures within a relatively narrow range. CryptoQuant also tracks the upper trader realized-price band near $88,700. Selling pressure has historically increased when Bitcoin price approaches that upper cost-basis band.
BTC Crypto Still Needs an $83K Reclaim
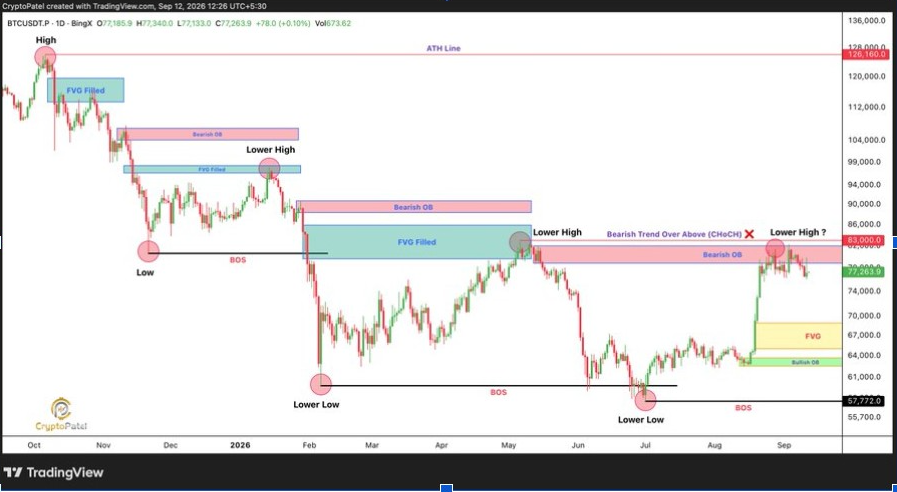
Crypto Patel described Bitcoin’s daily structure as bearish while price stays below $83,000. His chart tracks an all-time high, lower highs, a break of structure, and lower lows. The latest rebound has returned Bitcoin toward the $82,000 to $83,000 bearish order-block area.
A daily close above $83,000 would weaken that structure and open the door to a change of character. Continued rejection keeps lower support zones in focus. The same analysis marks a fair value gap near $68,000 to $69,000. It also places a broader demand zone around $62,000 to $64,000.
BlockHorizon data supports the importance of that lower area. Its chart shows about one million BTC held between $62,000 and $65,000 by short-term holders.
CryptoQuant separately identifies roughly 476,000 BTC accumulated between $62,000 and $65,000 during 2026.
Analysts Track $66K Support and Longer-Term Upside
Another technical view points to a possible move toward $66,000 to $68,000 during the fourth quarter. Wealthmanager said such a decline could complete the right shoulder of an inverse head-and-shoulders pattern. The chart then projects a recovery toward the low-$80,000 area if the pattern develops.
EGRAG Crypto takes a much longer view. His logarithmic channel keeps Bitcoin inside a rising macro structure that has held across several market cycles. He lists $220,000, $320,000 and $420,000 as long-term targets tied to channel structure, mean reversion and time expansion.
Those projections operate on a different timeframe from the current support test. Near-term Bitcoin price action centers on $77,000 support and the resistance cluster above $81,700.
This article is for informational purposes only and does not constitute financial or investment advice. Cryptocurrency investments involve risk. Readers should conduct their own research before making investment decisions.



