
 Altai the Tiger
 IGNITION
 streamoors
 Sword Inu
 NEAR Protocol
 Injective
 Quantus
- Charles Schwab Corporation’s (NYSE: SCHW) stock price is showing bullish strength and the price is forming higher highs.
- Charles Schwab Corporation’s stock price is currently trading at $58.52.
- SCHW’s live market cap is $106.5 Billion.
Charles Schwab Corporation (NYSE: SCHW) is a financial service provider company. It is US based company, a well-known supplier of brokerage, banking, and financial advice services. It was established in 1971.
Trend Analysis
The price of Charles Schwab Corporation (SCHW) stock is exhibiting signs of increasing momentum and higher highs are being established, according to an analysis of the daily timeline. The price has rose by 15.43% during the last two weeks to $58.52. This may indicate that the SCHW stock is going strong.
The stock peaked at $86.82 in January 2023. By May of the following year, the price fell by over 45%. The stock did find support near $48, and has since recovered rapidly, rising 30% in a merely two months. The SCHW stock has moved from a downtrend to an uptrend as a result of this significant shift, reversing the earlier downtrend.
A horizontal parallel channel pattern in the price movement highlights the stock’s strength even more. Despite the possibility of price pullbacks in shorter time frames, the overall trend is upward when considering the bigger picture.
Charles Schwab Corporation (NYSE: SCHW) Stock Price Analysis
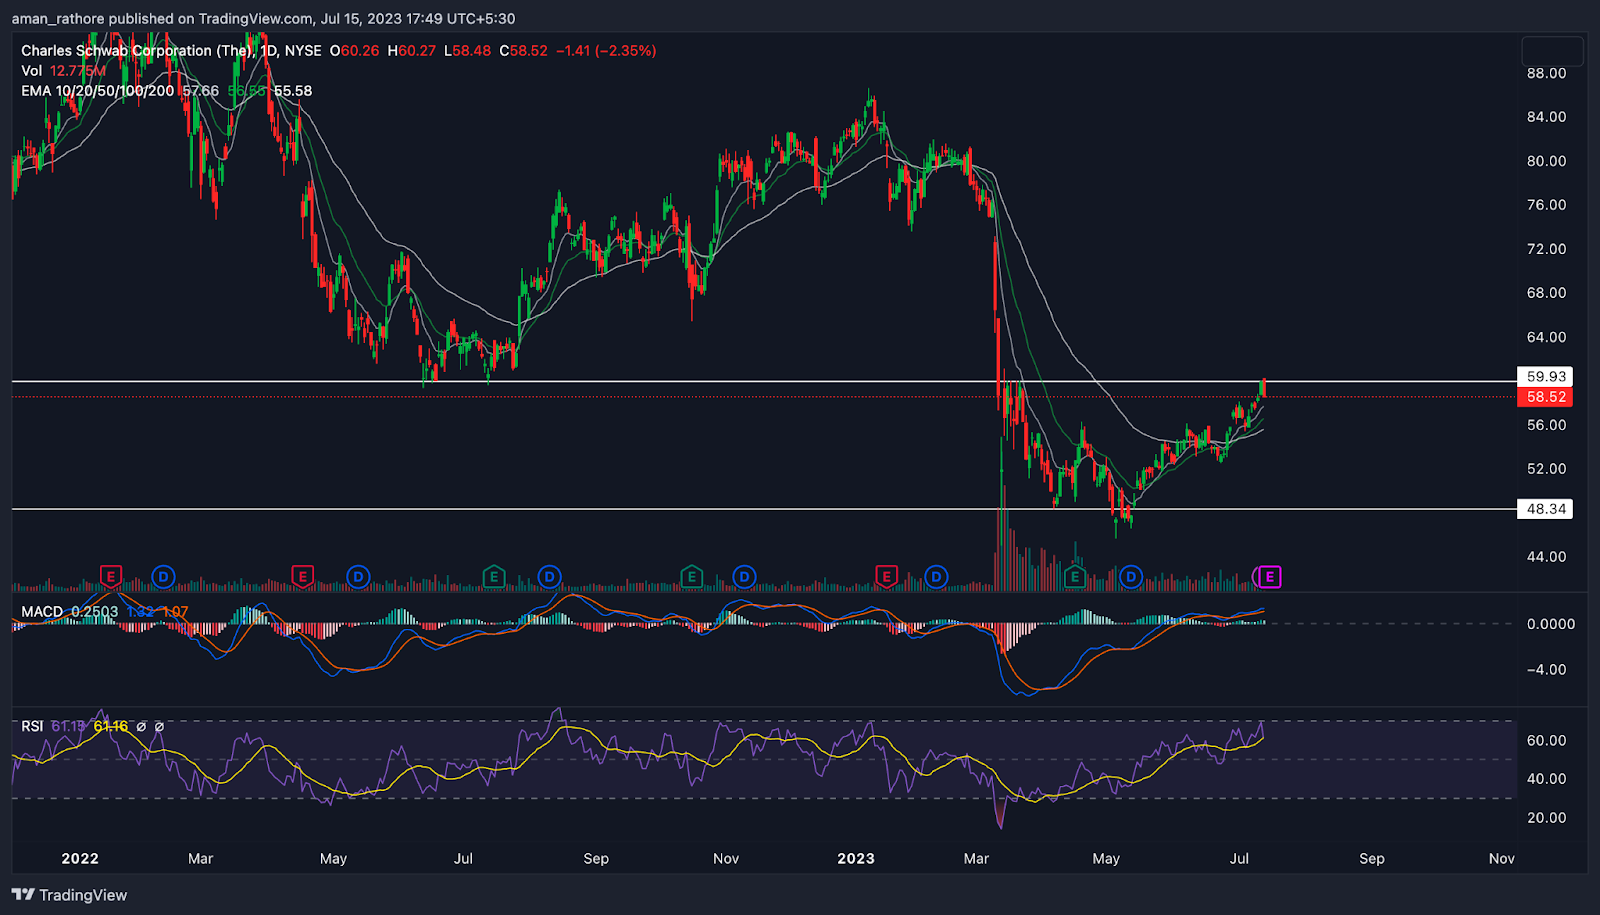
The 20, 50, and 100-day Exponential Moving Averages (EMA) for the stock of Charles Schwab Corporation may be seen on the price chart as being below the current price point. This is a strong indicator to give up move n future days.
The MACD indicator has a green histogram, and both MACD line and signal line are above zero. This alignment indicates high speed, which may indicate an uptrend in the market.
Additionally, the volume on the chart is steadily increasing, which denotes increased market activity. The fact that volume has increased suggests that consumers are joining the market at lower costs, which lends credence to the idea that a rise may be on the horizon.
Conclusion
The analysis reveals that the stock price of Charles Schwab Corporation (SCHW) is unmistakably exhibiting potential growth. The strong structure, with higher highs forming, indicates the strength of the stock. Additionally, the are indications ara faa momentum towards uptrend direction.
Technical Levels
- Support – The current support level of Charles Schwab Corporation (SCHW) is $48.
- Resistance -The current resistance level of the SCHW is $59.
Disclaimer
The views and opinions of the author, or anyone named in this article, are for informational purposes only. They do not offer financial, investment, or other advice. Investing or trading crypto assets involves the risk of financial loss.



